What is the Volume of a Stock? In-Depth Analysis
Exploring the Fundamentals of Stock Volume
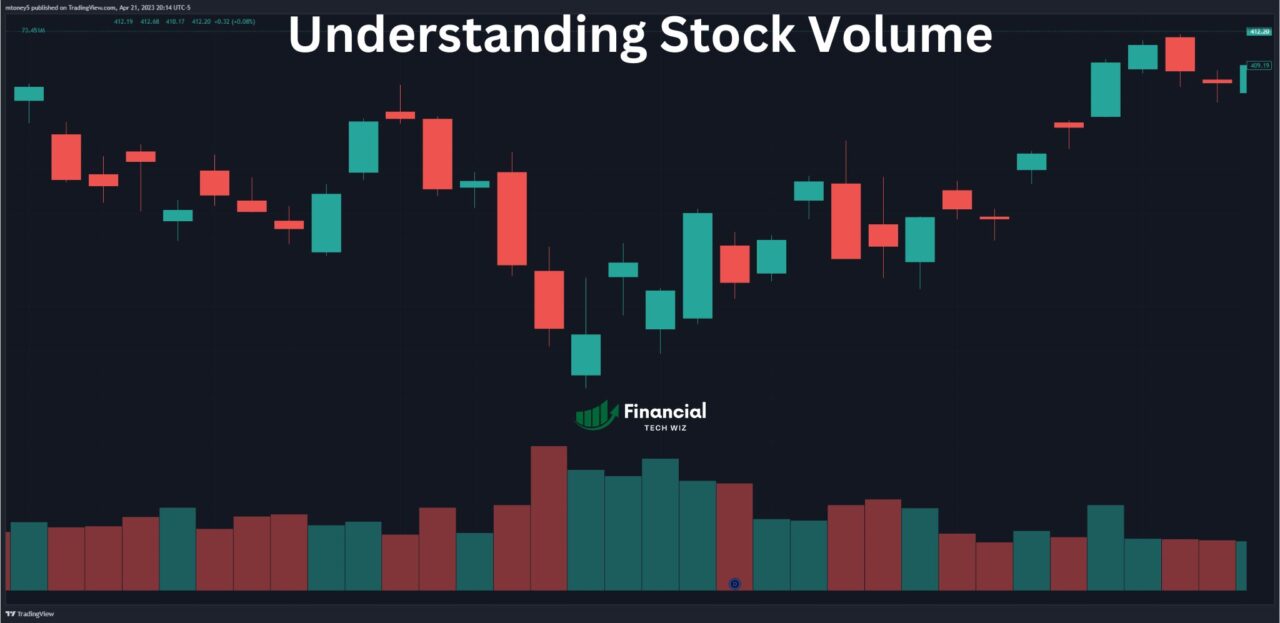
Stock volume is a vital metric in the world of trading and investing. It refers to the total number of shares of a particular stock that are bought and sold during a specified time frame, often measured on a daily basis.
But what does this mean for traders and investors, and why is volume such a critical indicator in technical analysis? Let’s delve deeper.
What is the Volume of a Stock?
- Defining Volume: Stock volume reflects the total number of transactions (both buying and selling) for a specific stock within a given period. For example, if ten transactions occur for a stock in a day, the daily volume is ten.
- Time Frames: Volume can be measured over different time frames, such as hourly or daily volume. Traders often analyze intraday volume for short-term strategies.
- Liquidity and Execution: Higher volume indicates higher liquidity, which results in better order execution and a more active market for connecting buyers and sellers.
Volume in Technical Analysis
Technical analysts rely on volume as a key component of their decision-making process. Volume provides valuable insights into the relative significance of price movements and potential entry and exit points.
- Price Movement Significance: The higher the volume during a price move, the more significant the move. Conversely, low volume casts doubt on the strength of the move.
- Trend Confirmation: By examining volume trends, analysts use volume to confirm price movements. For instance, increasing volume on an upward price trend is a bullish signal.
Volume Analysis Tools: Volume Profile and VWAP
In addition to basic volume analysis, traders use advanced indicators, such as Volume Profile and VWAP, to read volume in a valuable way.
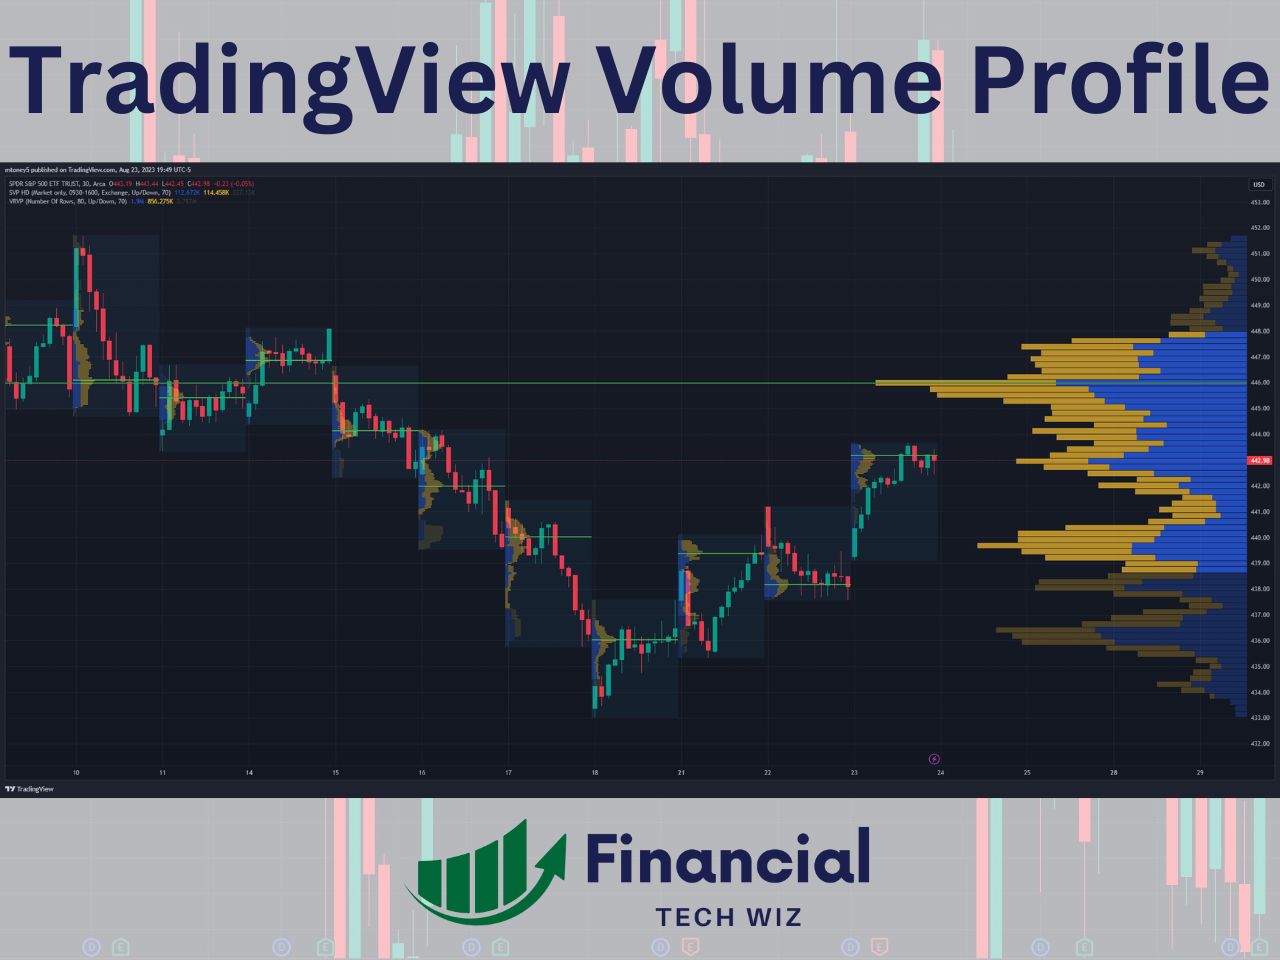
Discovering Key Support and Resistance Levels with Volume Profile
Volume Profile is a powerful analysis tool that provides a visual representation of volume distribution across different price levels.
- Volume Profile helps identify key support and resistance levels where trading activity is concentrated.
- Learn more about TradingView Volume Profile here.
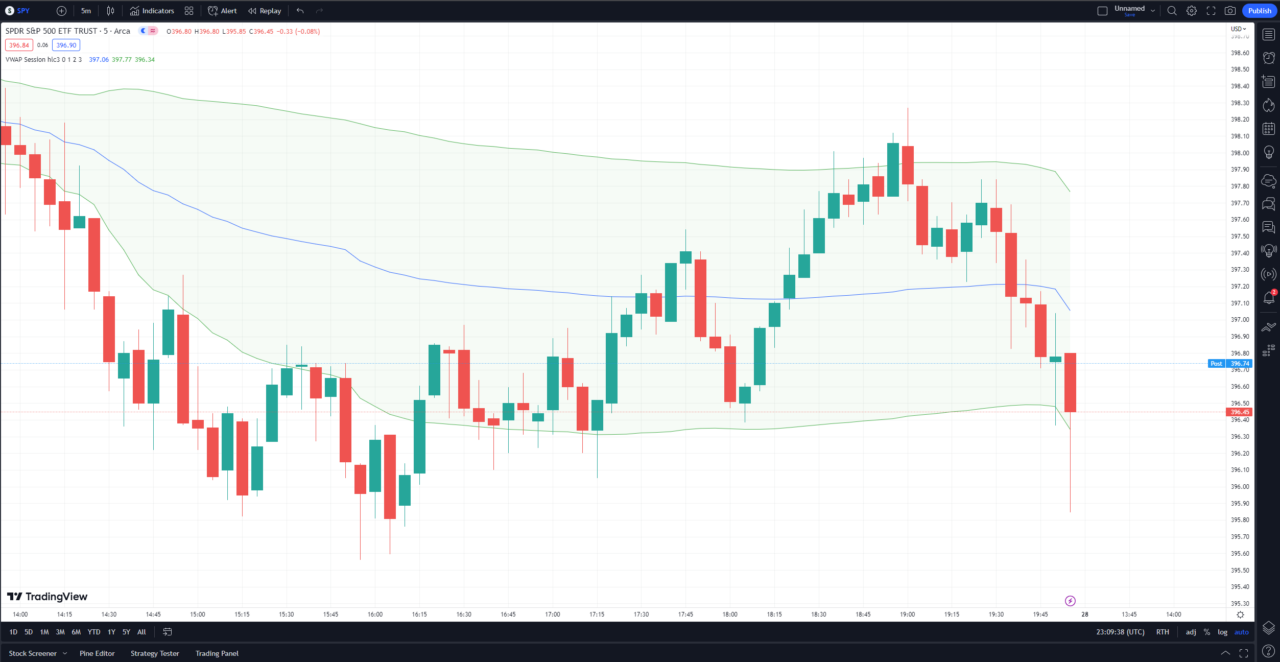
Assessing Fair Value with Volume Weighted Average Price (VWAP)
VWAP is a benchmark indicator that calculates the average price of a stock weighted by volume.
- VWAP offers insights into whether a stock is overvalued or undervalued relative to its average price.
- Explore how traders use VWAP on TradingView here.
Impact of High-Frequency Trading on Volume Dynamics
High-frequency traders (HFT) and algorithmic trading contribute significantly to trading volume. Passive investors, such as ETFs and index funds, account for a large portion of trading volume, influencing market dynamics.
Making Informed Decisions with Volume Analysis
- Confirming Trends: Use volume to confirm price trends and detect potential reversals.
- Unusual Activity: High spikes in volume may indicate significant news or events affecting the stock.
- Market Sentiment: Volume analysis helps gauge overall market sentiment and investor confidence.

Concluding Thoughts: Maximizing the Potential of Volume Analysis
In summary, volume analysis is a versatile and essential tool for traders and investors. While it offers valuable insights, volume should be used in conjunction with other technical indicators for a holistic approach. By harnessing the power of volume, traders can make more informed decisions and navigate the ever-changing landscape of the financial markets.
Learn how to add volume to your TradingView chart in this article.
This article contains affiliate links I may be compensated for if you click them.
Get Your Free Trading Resources
Grab the free trading journal template plus the same tools we use to stay organized, consistent, and objective.
- Free trading journal template
- Custom indicators, watchlists, and scanners
- Access our free trading community
Enter your email below to get instant access.
No spam. Unsubscribe anytime.


