dragonfly doji

Doji Candle Types: Dragonfly, Gravestone & More

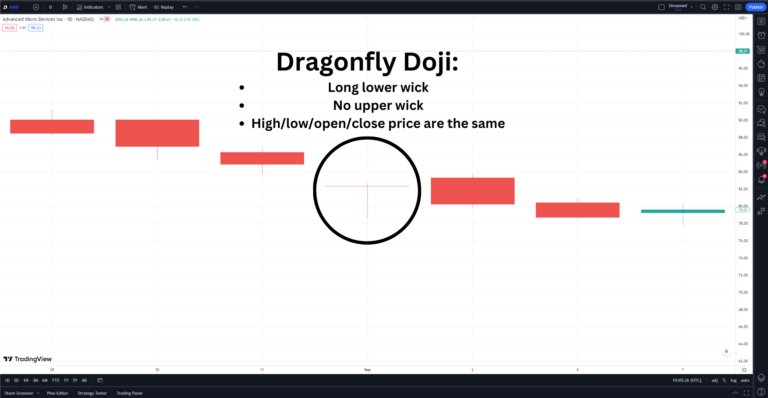
The Doji candlestick pattern is an essential technical analysis tool traders and investors often use to understand market sentiment. This article explores the meanings, types, and trading implications of the Doji pattern. Understanding the Doji Candlestick Pattern The Doji candlestick pattern is characterized by its distinct “cross” shape, where the opening and closing prices of…

tradingview footprint chart

TradingView Footprint Charts Explained

Footprint charts aren’t commonly offered on popular trading platforms, but TradingView now offers the ability to access them as a native feature. Footprint charts allow you to visualize buying and selling volume data for every candle, which pairs great with the new TradingView market profile. Continue reading to learn how to use the volume footprint…

tradingviewvolumeprofilefeatured
|

TradingView Volume Profile: A Comprehensive Guide for Traders

The volume profile is an advanced charting study that shows the amount of trading volume at specific price levels. It is a great way to find support and resistance levels, but you must know how to use the proper time frames and types of profiles to apply them to your trading properly. The volume profile…

tradingview vwap indicator
|

VWAP on TradingView: Mastering Volume Weighted Average Price

The Volume Weighted Average Price (VWAP) is a powerful technical indicator intraday traders use to make informed decisions. VWAP measures the average price of an asset, weighted by its trading volume. As a popular charting platform, TradingView provides traders with easy access to the VWAP indicator. This comprehensive guide will explore how to use VWAP…

Morning Star Pattern

Morning Star Pattern: A Bullish Reversal Signal

Candlestick patterns are powerful tools used by traders and investors in technical analysis. One such pattern that often grabs the attention of market participants is the morning star pattern—a notable bullish reversal pattern that signals a potential bottom in a downtrend. In this article, we’ll explore the characteristics of the morning star pattern, its reliability,…

thinkorswimivrank

How to See Implied Volatility (IV) Rank on thinkorswim

Discover the difference between IV rank and IV percentile and how you can add IV rank to the thinkorswim platform. What are Implied Volatility and Historical Volatility Before we get into implied volatility rank (IVR), we must understand implied volatility (IV) and historical volatility (HV). HV is also known as realized volatility. The implied volatility…

markminervini

Mark Minervini’s Trading Strategy: 8 Key Takeaways

Stock market wizard Mark Minervini’s trading strategy won him the U.S. investing championship. Mark Minervini’s Trading Strategy Mark Minervini is known for trading fast-moving growth stocks while implementing a concrete entry and exit strategy. Minervini believes that timing your trades is critical and recommends you combine technical analysis, fundamental analysis, and risk management. Mark Minervini…