StockCharts vs. TrendSpider Compared
TrendSpider and StockCharts are popular trading platforms, but TrendSpider is clearly the more advanced and featured filled product. TrendSpider allows you to code custom indicators with just a prompt and comes with dedicated custom support. Continue reading to learn more about both of these platforms, and why I think TrendSpider is a better option than StockCharts.
- Pricing: $74-$149/month
- Create custom indicators with AI
- Extensive backtesting and customer support
Key Takeaways
- TrendSpider excels in providing automated analysis tools, customer support, custom indicators, and supports a wide range of assets including stocks, ETFs, crypto, forex, and futures.
- StockCharts offers a wide array of technical indicators and a user-friendly interface, primarily focusing on stocks and ETFs.
- While TrendSpider is ideal for active and technical traders seeking advanced functionalities, StockCharts could be better for less advanced traders, or those seeking data.
Key Characteristics of StockCharts and TrendSpider
| Platform | Supported Assets | Charting Features | Data | Premium Pricing |
|---|---|---|---|---|
| StockCharts | Stocks & ETFs | Web-based charting platform with access to several chart types and indicators | Daily, weekly, and monthly time frames are free, but you must purchase the ability to use intra-day data | $19-$50 per month |
| TrendSpider | Stocks, ETFs, futures, crypto, and forex | Advanced web-based and mobile charting platform | Real-time data included in subscription price, plus bring in external data via 3rd party APIs | $74-$149 per month |
Overview of TrendSpider
Pricing: $74-$149/month
Features:
- Real-time data across stocks, ETFs, crypto, forex, and futures.
- Automated technical analysis tools.
- Excellent customer support included in all plans.
- Ability to build trading bots with indicators and AI without coding.
- Custom indicator creation with AI prompts.
- Backtesting strategies within seconds.
- Advanced market scanners.
- Raindrop charts and volume profiles.
- Up to 16 charts per layout.
Who is TrendSpider Best For?
- Users trading multiple asset classes.
- Active traders who value automation, customer support, custom indicators, backtesting, and advanced analytics.
TrendSpider Special Offer!
Exclusive Deal: 25% Discount with Code FTW25
Elevate Your Trading – Join TrendSpider Today!
- AI-Powered Analysis
- Automated Technical Analysis
- 16 charts per layout
Overview of StockCharts
Pricing: $19-$50/month
Features:
- Extensive range of chart types and technical indicators.
- Daily, weekly, and monthly charts; intraday data available with a paid subscription.
- Classic interface suitable for swing traders.
Who is StockCharts Best For?
- Users who prefer traditional charting methods and simplicity.
- Traders looking for free basic charts.
- Traders focusing primarily on stocks and ETFs.
Detailed Comparison: TrendSpider vs StockCharts
Charting Features and Technical Analysis Tools
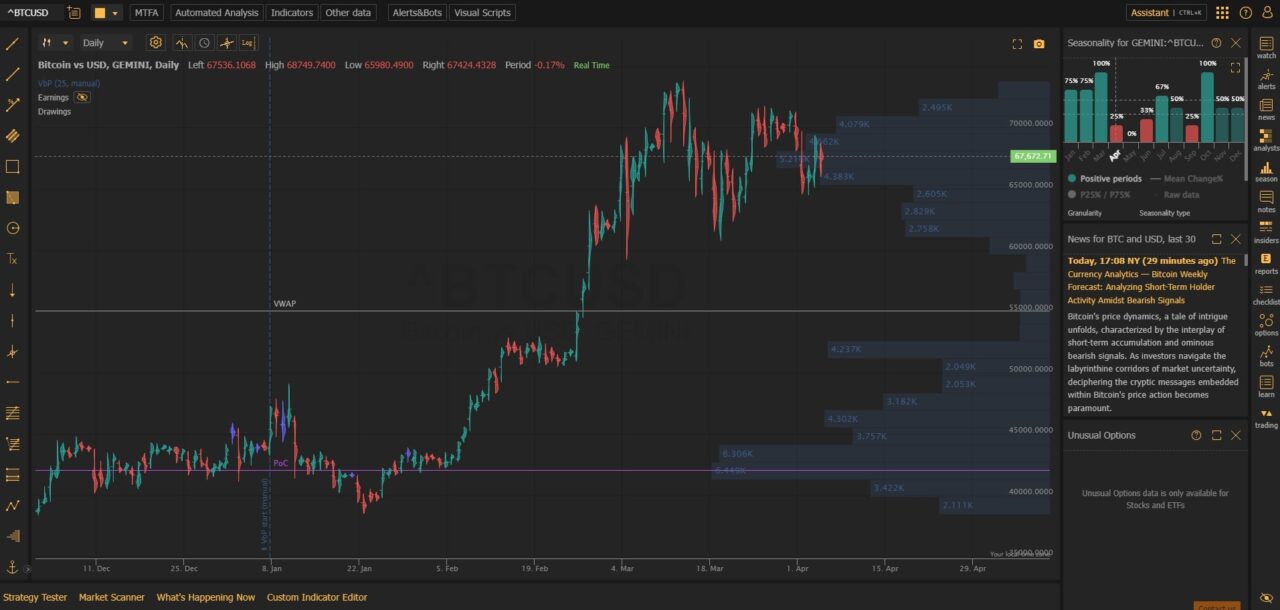
TrendSpider: Offers automated trendline detection, advanced indicators like Volume Profile and Raindrop Charts, customizable alerts, AI-driven custom indicator building, rapid backtesting capabilities, and connection to third-party APIs for enhanced functionality.
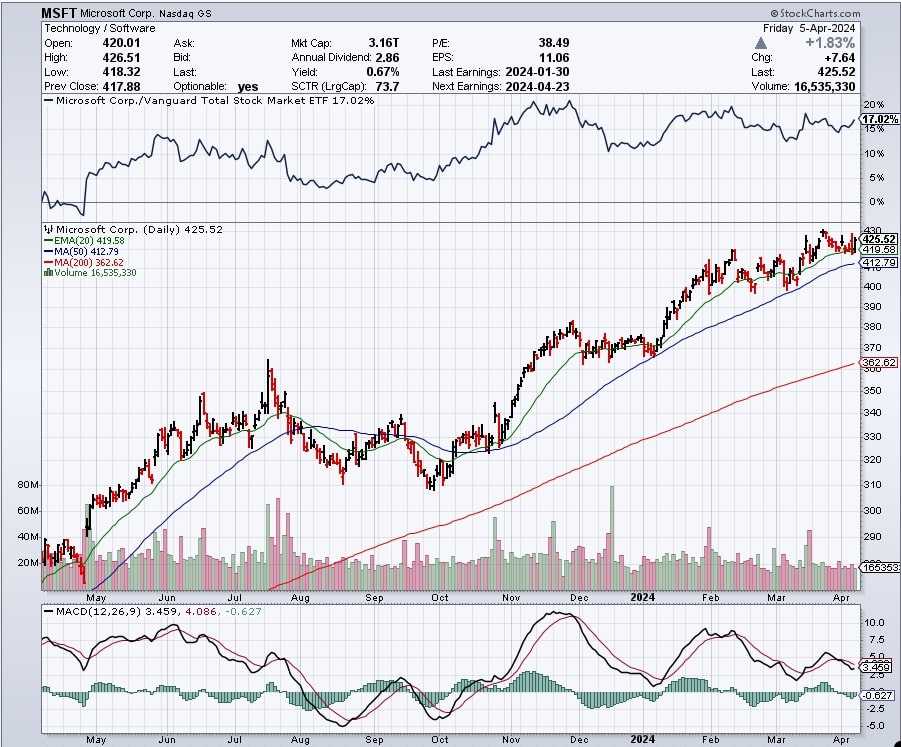
StockCharts: Provides traditional indicators such as moving averages, Fibonacci retracements, and RSI. It offers a simple yet extensive toolset for classical analysis with limited automation capabilities compared to TrendSpider.
Asset Coverage
| Asset Class | TrendSpider | StockCharts |
|---|---|---|
| Stocks | ✅ | ✅ |
| ETFs | ✅ | ✅ |
| Crypto | ✅ | ❌ |
| Forex | ✅ | ❌ |
| Futures | ✅ | ❌ |
- Ideal for multi-market traders: TrendSpider
- Ideal for traditional stocks and ETF traders: StockCharts
Pricing and Value for Money
TrendSpider’s higher cost is justified by its extensive automation features, customer support, and broad asset coverage. StockCharts, being more affordable, provides great value for traders who require simpler functionalities.
User Experience and Interface
TrendSpider: Features a modern, intuitive interface suitable for both beginners and advanced users.
StockCharts: Offers a classic, dated-looking layout.
Mobile Accessibility
TrendSpider App: Provides real-time data synchronization and advanced mobile features, ensuring a seamless experience similar to the desktop version.
StockCharts App: Delivers essential features and indicators, suitable for quick market checks with basic functionality.
Pros and Cons Summary
| Platform | Pros | Cons |
|---|---|---|
| TrendSpider | Automation, customer support, real-time data, supports multiple assets including crypto, forex, and futures. | Higher pricing, potentially overwhelming for beginners. |
| StockCharts | Cost-effective, easy-to-use, strong in traditional technical analysis. | Dated interface, limited asset coverage. |
Who Should Choose TrendSpider?
- Active traders needing automation.
- Multi-asset traders.
- Traders who prioritize advanced indicators and real-time analysis.
- Serious traders who like to backtest and build scanners.
Who Should Choose StockCharts?
- Cost-sensitive traders.
- Swing traders focusing primarily on stocks/ETFs.
- Users who just want free charting tools.
Which is Best For You?
When deciding between TrendSpider and StockCharts, consider your specific trading needs and strategies. TrendSpider is suitable for those who require sophisticated tools and real-time data across various markets, while StockCharts is ideal for users seeking simplicity and cost-effectiveness in stock and ETF trading. Trying both platforms may be beneficial to determine which one aligns best with your trading style.
Related Trading Platform Comparisons
Interactive Brokers vs Tradovate
Get Your Free Trading Resources
Grab the free trading journal template plus the same tools we use to stay organized, consistent, and objective.
- Free trading journal template
- Custom indicators, watchlists, and scanners
- Access our free trading community
Enter your email below to get instant access.
No spam. Unsubscribe anytime.


