Finviz vs. StockCharts
Discover our detailed comparison of Finviz and StockCharts to help determine which is best for you. Whether you’re a seasoned trader or just starting out, choosing the right platform can significantly impact your trading experience.
To make your research easier, we manually found key data for Finviz and StockCharts across the internet and compiled it all in this article.
Overview of Finviz
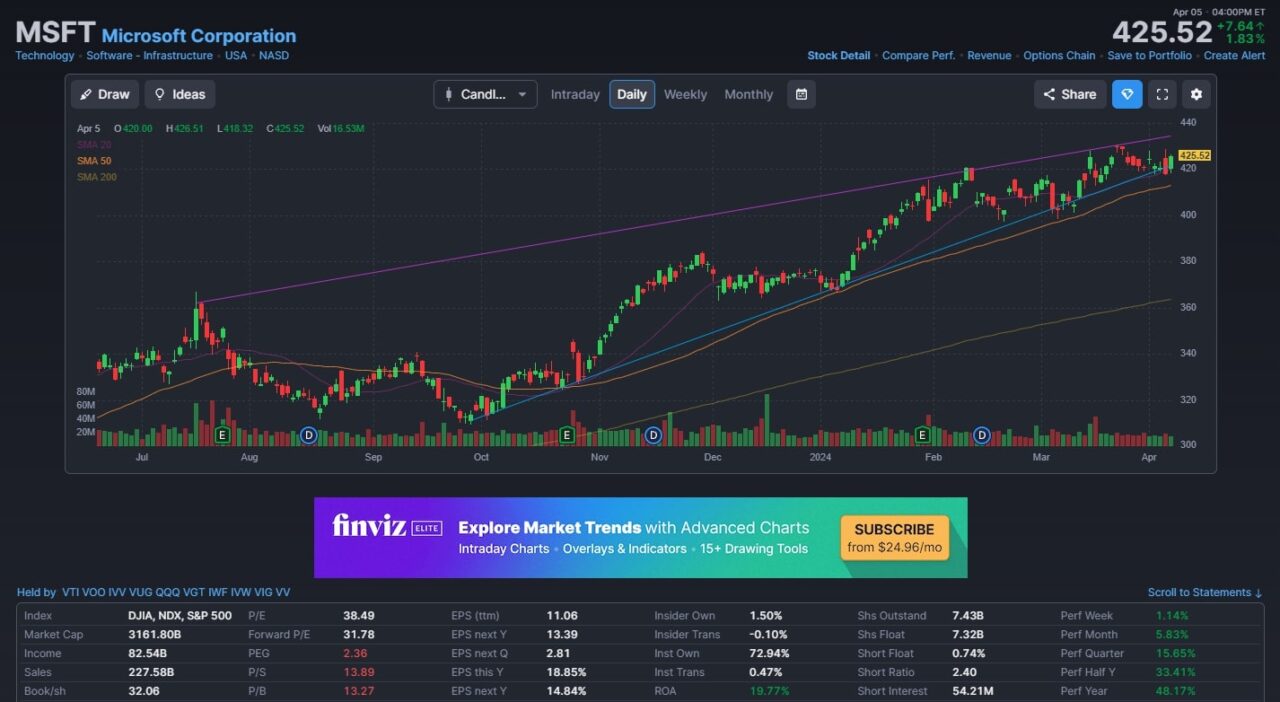
Finviz is a great charting and fundamental analysis software primarily designed for stocks, but it does offer some features for crypto, futures, and forex. You can view charts, analyst price targets, and useful fundamental data quickly for most tickers.
✓ Pricing: $24-$40/month
✓ Excellent screeners
✓ Fundamental analysis tools
Finviz is Best For
Finviz is best for swing traders who want a free charting platform and an easy way to view key fundamental data and analyst price targets. The platform has cool features like auto-trendlines and indicators to help you quickly analyze good trading and investing opportunities. Finviz Elite is great for day traders who want intraday data, but keep in mind TradingView includes nearly real-time intra-day data for free on most tickers.

Overview of StockCharts
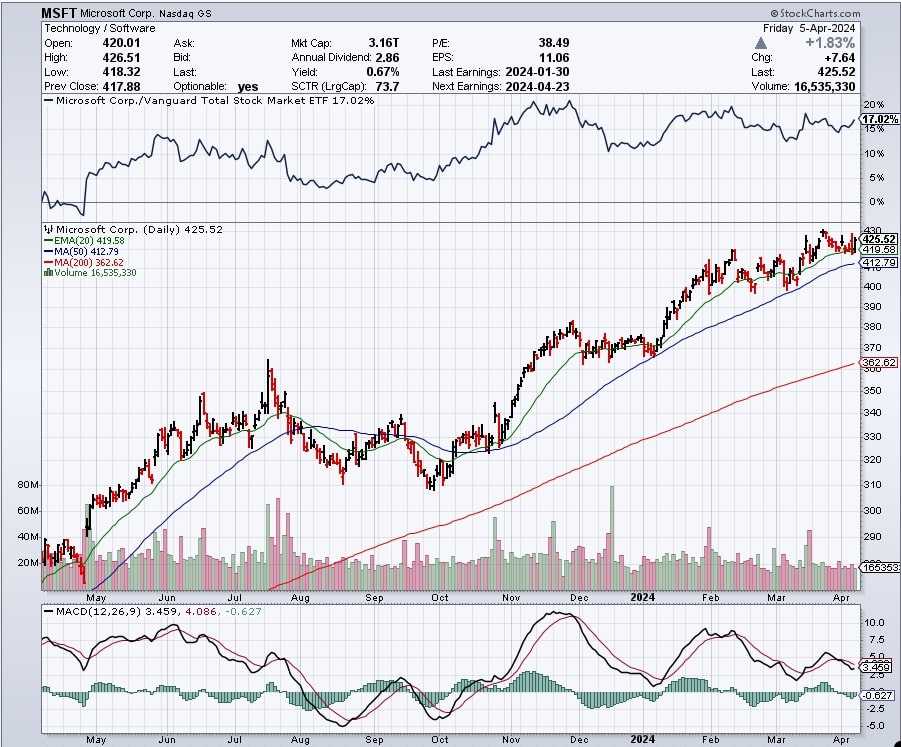
StockCharts is a stock charting platform that is great for technical analysis since it allows you to use various indicators. However, the platform looks a bit dated, especially compared to platforms like TradingView and TrendSpider. It is also lacking in some fundamental data features, and does not provide free intra-day charting like TradingView.
✓ Pricing: $19-$50/month
✓ Extensive market data
✓ Decent charting tools
StockCharts is Best For
StockCharts is best for swing traders who want a free charting platform for daily time frames and longer. You can access intra-day with a paid subscription, but there are many platforms that offer more features like TradingView and Finviz.

Key Characteristics of Finviz and StockCharts
| Platform | Platform Type | Tradeable Assets | Charting Features | Data | Premium Pricing |
|---|---|---|---|---|---|
| Finviz | Charting and Screening Software | Not a broker, but you can chart stocks, ETFs, futures, crypto, and forex | Provides web-based charting tools for stocks, futures, crypto, and forex, including technical indicators and interactive charts | Daily, weekly, and monthly time frames are free, but you must purchase Finviz Elite for intra-day data | $24-$40 per month |
| StockCharts | Charting Software | Not a broker, but you can chart stocks & ETFs | Web-based charting platform with access to several chart types and indicators | Daily, weekly, and monthly time frames are free, but you must purchase the ability to use intra-day data | $19-$50 per month |
Trading Features and Tools
| Platform | DRIP | Margin Trading | Insurance | Mobile App |
|---|---|---|---|---|
| Finviz | Not a broker | Not a broker | Not a broker | No |
| StockCharts | Not a broker | Not a broker | Not a broker | Yes |
Trading Costs and Commissions Compared
| Fee Type | Finviz | StockCharts |
|---|---|---|
| Equity Commission | Not a broker | Not a broker |
| Option Commission | Not a broker | Not a broker |
| Futures Commission | Not a broker | Not a broker |
| Futures Options Commission | Not a broker | Not a broker |
| Option Exercise Fee | Not a broker | Not a broker |
Finviz vs StockCharts – Bottom Line
Choosing between Finviz and StockCharts depends on your specific trading needs, preferred trading tools, and the type of assets you’re interested in.
Both platforms offer distinct advantages, but by considering the detailed comparison above, you can select the one that aligns best with your trading strategy and goals.
For more detailed reviews and comparisons, continue exploring our other articles on brokerage platform comparisons.
What is the Overall Best Charting Software?
I have reviewed and used nearly every trading platform available, and I believe that TradingView is the best overall charting software available. Here are some reasons why:
- All of TradingView’s key features are free to use
- TradingView provides real-time data for free whenever possible
- You are not tied to a single broker and can use whichever you want while charting on TradingView
- You can track all markets on a single platform, including stocks, ETFs, crypto, forex, and futures.
- TradingView has an excellent economic calendar and various screeners
Exclusive Deal: 30-Day FREE Premium Access + Bonus Credit
Don’t Miss Out – Sign up for TradingView Now!
- Advanced Charts
- Real-Time Data
- Track all Markets
If you sign up for a TradingView account using my affiliate link, you can get a 30-day free trial of its premium features plus a $15 credit toward your subscription. However, signing up for a free trial is not required, and you can use nearly all of its features with a basic free account. You can read my full review of TradingView to learn more.
Related Trading Platform Comparisons
– Free trading journal template & cheat sheet PDFs
– Custom scanners, watchlists, & market commentary
– Access our free trading course and community


