Inverse Cup and Handle: How You Can Trade It
The inverse cup and handle pattern is a bearish variation of the traditional cup and handle pattern.
Is the Inverse Cup and Handle Pattern Bullish or Bearish?
The Inverse Cup and Handle, or the inverted cup and handle, is a bearish reversal pattern that typically appears during an uptrend.
Not only does it signal a potential downtrend, but it also indicates a shift from bullish to bearish sentiment. To be specific, this pattern is undeniably bearish in nature.
Identifying an Inverse Cup and Handle Pattern
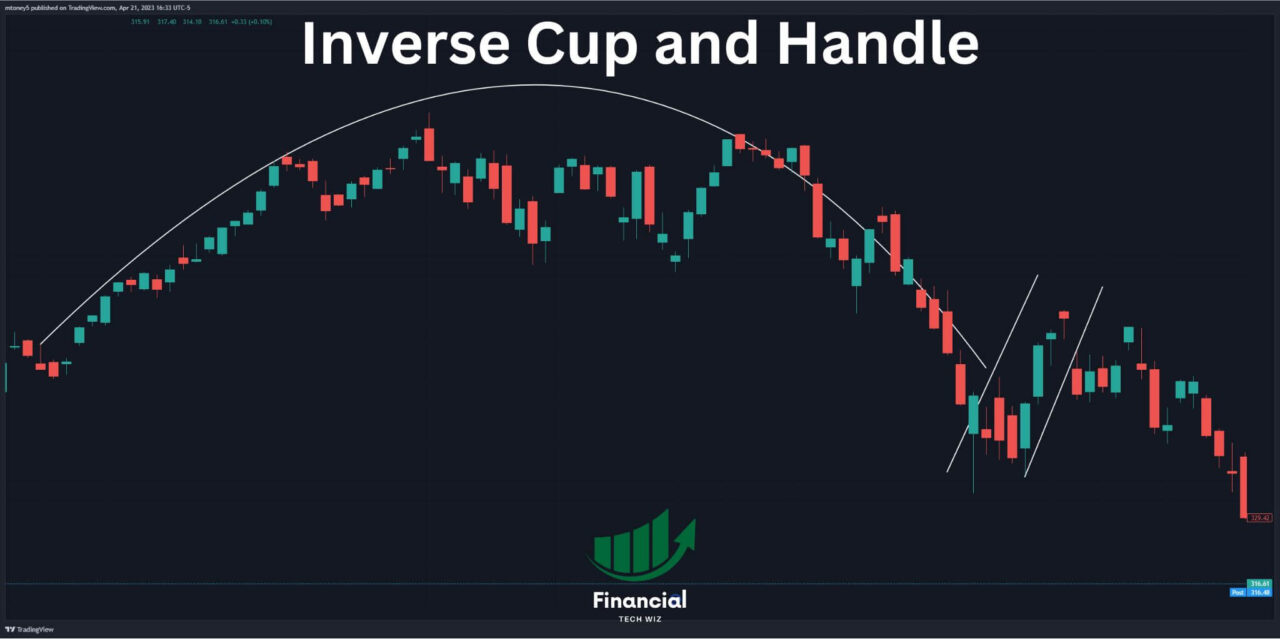
The Inverse Cup and Handle consists of two key components:
- The Cup: Characterized by an inverted U-shape or rounded top, the cup forms as the price experiences a decline.
- The Handle: Following the cup, the handle emerges through a consolidation period or small upward price movement.
Together, these components paint a pattern resembling an upside-down teacup.
Best Timeframe for an Inverted Cup and Handle
The Inverse Cup and Handle can manifest over varying time frames but is most commonly observed on daily or weekly charts.
Depending on the asset being traded and prevailing market conditions, the pattern’s formation can span from several weeks to months.
Post-Pattern Price Movement
Upon the pattern’s completion, traders focus on the neckline—the resistance level at the top of the cup. A breakout below the neckline (top of the cup) is a strong bearish signal, often accompanied by a surge in trading volume. This breakout paves the way for a potential downtrend, with traders considering short positions.
How to Trade the Inverse Cup and Handle Pattern
The proper time to enter a short position based on the inverse cup and handle pattern is when the price breaks below the handle.
Once you place your short position, you must determine where to set your stop-loss and take-profit orders.
When to Take Profit
The target for the inverse cup and handle is the difference between the top of the cup and the breakout level. For example, if the distance between these two levels is $20, you will set a limit order to take profit when the stock falls 20 points below the handle.
Where to Set Your Stop
Depending on your risk tolerance, you can set a stop-loss below the cup or the handle. The pattern is no longer valid if the price fails to break below either.
The Stages of the Inverse Cup and Handle:
- The Breakout: The short sale point occurs when the price breaks below the support level formed by the handle’s lower boundary. A strong breakout with increased volume is a positive sign.
- Price Targets: After the breakout, traders can estimate potential price targets by measuring the height of the cup and projecting it downward from the breakout point.
- Risk Management: Implementing stop-loss levels above the handle’s resistance or at a predetermined percentage is essential for managing risk.
Inverse Cup and Handle Example on QQQ ETF
The Inverse Cup and Handle pattern was evident on the QQQ ETF at the end of 2021, as seen on the daily timeframe.
You can clearly see the inverted cup and handle on the chart below, especially after using some drawing tools on TradingView.
If you wanted to take this trade, you would short when the price broke below the trendline furthest to the right. For practice, go take a look at the QQQ chart in 2021 on the daily timeframe on TradingView and see if you can spot it yourself!
Chart Analysis with Precision: TradingView
If you aren’t already, consider signing up for a free TradingView account. TradingView is one of the best charting platforms available by far and is perfect for spotting patterns and offers tons of technical indicators.
With our affiliate link, you get a discount and a 30-day free trial for the premium features as well.

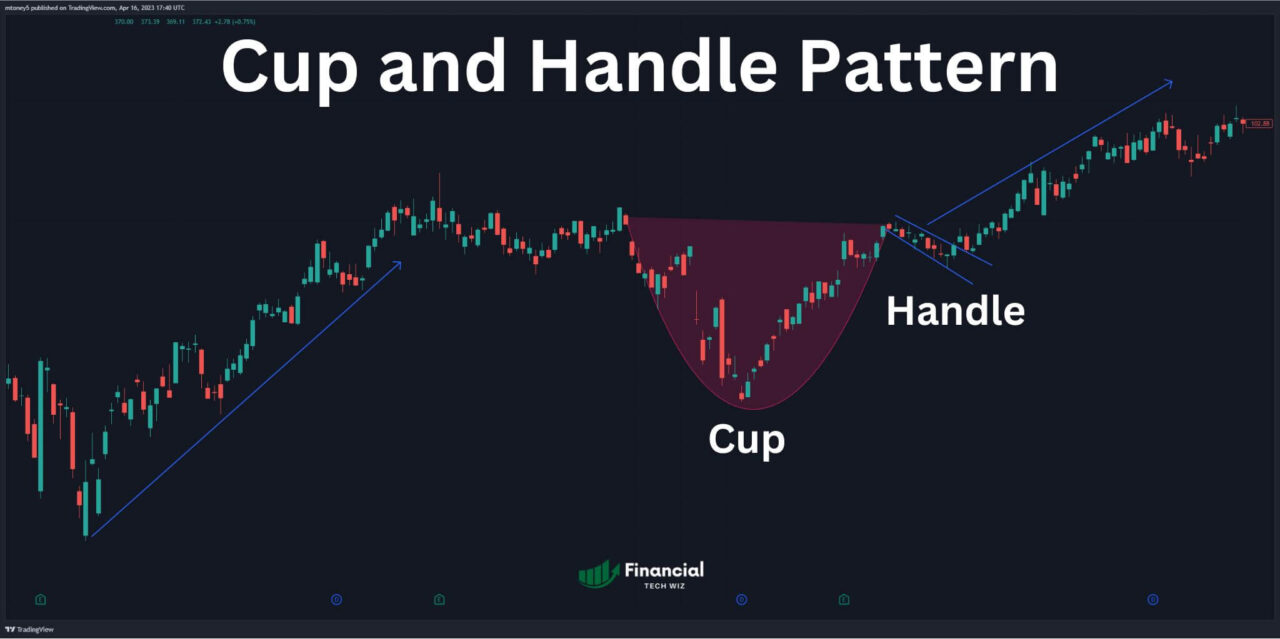
Contrasting with the Cup and Handle: The Bullish Counterpart
The Inverse Cup and Handle finds its bullish counterpart in the Cup and Handle pattern.
While the inverse pattern signals a bearish trend reversal, the Cup and Handle points to a bullish one.
Expanding Your Toolkit: Additional Resources
A curious trader’s journey doesn’t end here. Explore the Volatility Contraction Pattern (VCP) and expand your knowledge of chart patterns.
Inverse Cup and Handle Pattern Final Thoughts
Understanding the Inverse Cup and Handle pattern is a stepping stone to informed trading. As traders navigate the financial markets, recognizing and understanding chart patterns like the Inverse Cup and Handle becomes a valuable skill.
These patterns offer insights into potential price movements and enable traders to make strategic decisions aligned with market trends. However, it’s important to remember that no chart pattern guarantees success, and trading always carries inherent risk.
This article contains affiliate links I may be compensated for if you click them.
Get Your Free Trading Resources
Grab the free trading journal template plus the same tools we use to stay organized, consistent, and objective.
- Free trading journal template
- Custom indicators, watchlists, and scanners
- Access our free trading community
Enter your email below to get instant access.
No spam. Unsubscribe anytime.


