SMA vs. EMA vs. WMA: Which Moving Average Should You Use?
Moving averages are the most widely used technical indicators in trading. The difference between SMA, EMA, and WMA comes down to how each type weights price data and how quickly it responds to new market information. Choosing the right one depends on your trading style and the timeframe you are operating on.
Key Takeaways
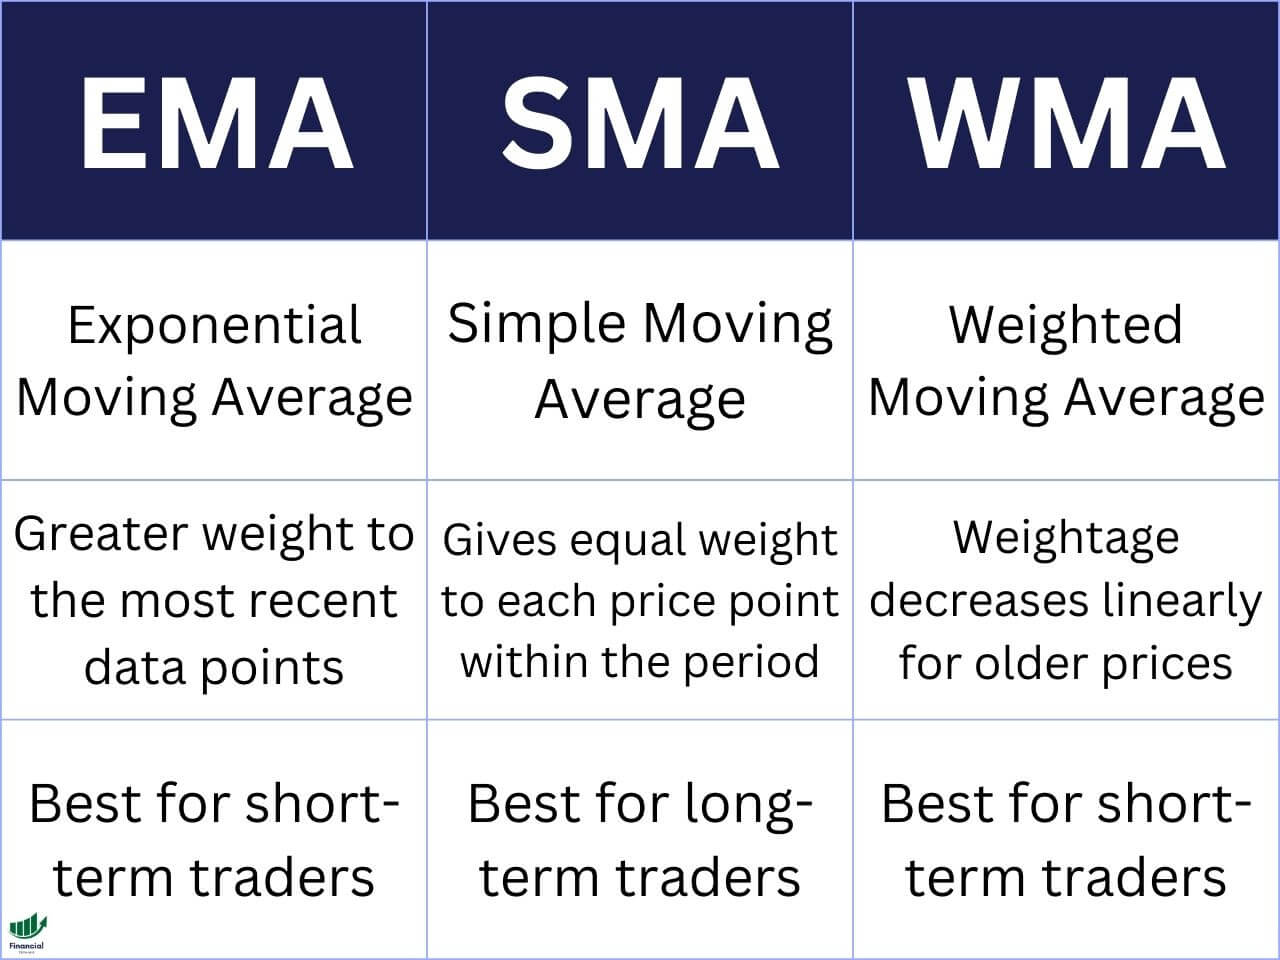
- SMA assigns equal weight to all price points in a period and is most useful for identifying long-term trends
- EMA gives exponentially more weight to recent prices and is the preferred choice for day traders and swing traders
- WMA applies linear weighting to recent prices and is faster than SMA but less commonly used than EMA
SMA vs. EMA vs. WMA: Side-by-Side Comparison
| SMA | EMA | WMA | |
|---|---|---|---|
| Weighting | Equal | Exponential | Linear |
| Responsiveness | Slowest | Fastest | Medium |
| False Signals | Fewest | Most | Moderate |
| Best For | Long-term trends | Short-term trading | Intermediate setups |
| Popularity | High | High | Low |
Start Using MA, EMA, SMA, & WMAs on TradingView For Free!
Enhance Your Trading Strategy – Sign up for TradingView Today!
- Comprehensive Moving Average Tools
- Real-Time Data Analysis
- Customizable Chart Indicators
What is a Moving Average (MA)
A moving average (MA) is a technical indicator that smooths price data by calculating a continuously updated average price over a defined time period. It removes short-term noise from a price chart, making the underlying trend easier to read.
Moving averages are lagging indicators. They are calculated using past price data, so they confirm trends rather than predict them. This is why the differences between MA types matter: the faster an indicator reacts to price, the sooner you get a signal, but the more false signals you will encounter.
The three most common types are the Simple Moving Average (SMA), the Exponential Moving Average (EMA), and the Weighted Moving Average (WMA).
MA vs. EMA Compared
When comparing MA and EMA, the primary difference lies in sensitivity. The EMA is more sensitive to recent price changes than the MA, which can lead to early signals for entering or exiting trades.
SMA vs. EMA Compared
SMA and EMA are both types of moving averages but differ in their calculation. The SMA assigns equal weight to all values, while the EMA gives more weight to recent data, offering a quicker response to price changes.
SMA vs. MA Compared
The SMA is a type of MA with a specific method of calculation – it calculates the average price over a set period without weighting. In contrast, other MAs, like the EMA and WMA, apply different weightings.
WMA vs. EMA Compared
Both WMA and EMA give more importance to recent data but differ in their approach. The WMA uses a linear weighting method, while the EMA uses an exponential approach, making the EMA quicker to react to recent price movements.
Join for FREE: Access tons of free educational material!
Don’t miss out – Join now and start learning!
- Free Educational Material
- Community for Like-Minded Traders
- Personalized Trading Education
What is the Simple Moving Average (SMA)
The SMA is the most straightforward moving average. It calculates the arithmetic mean of closing prices over a set number of periods. Every price point in the lookback window receives equal weight.
Formula: SMA = (Sum of closing prices) / (Number of periods)
For example, a 10-day SMA adds the last 10 closing prices and divides by 10. When a new day closes, the oldest price drops off and the newest price is added.
Common SMA Settings
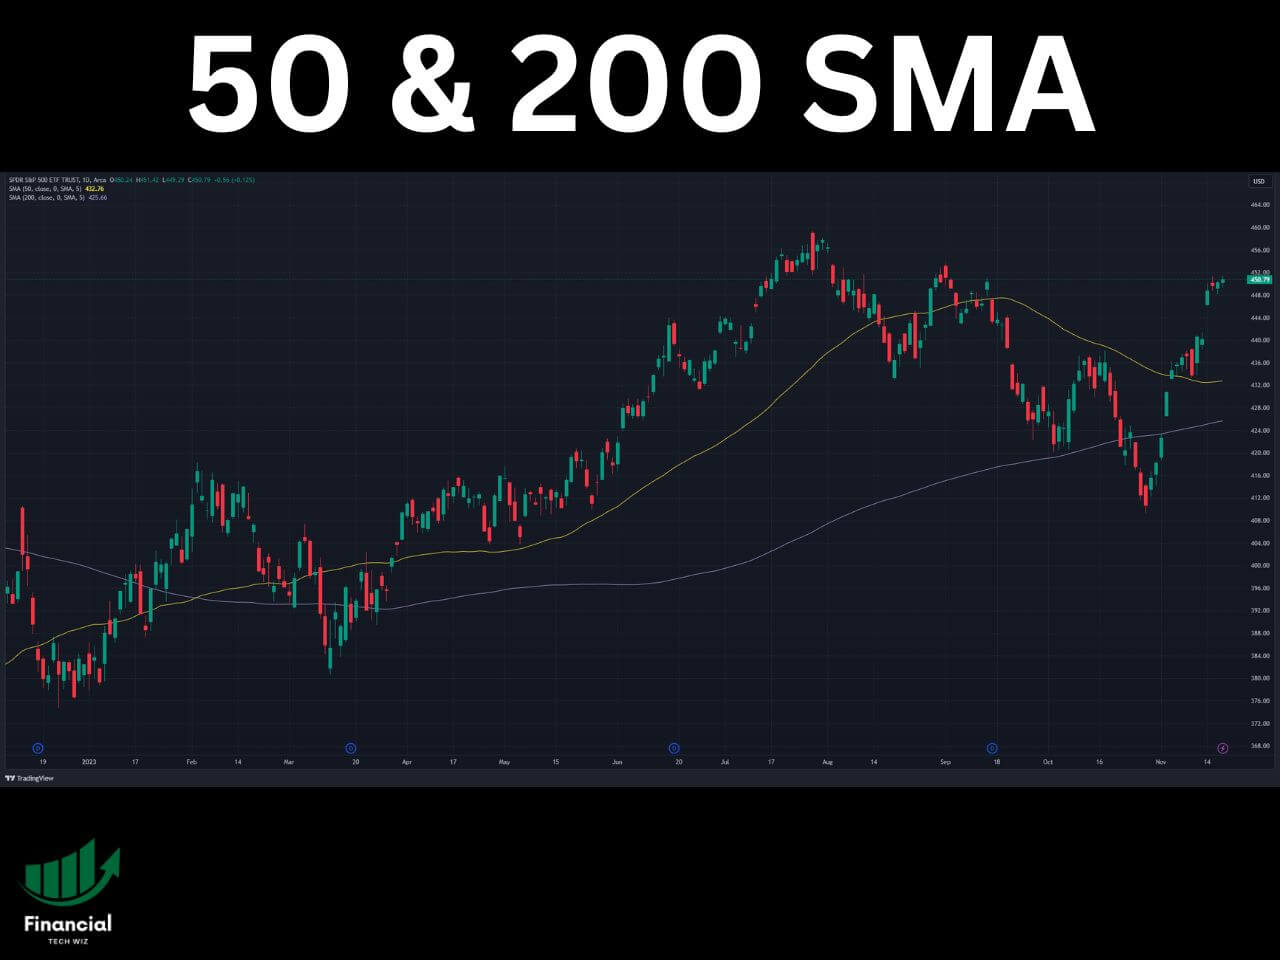
- 50-day SMA: standard medium-term trend indicator
- 200-day SMA: widely watched by institutional traders as the long-term trend line
When the 50-day SMA crosses above the 200-day SMA, traders call this a golden cross, which is considered a long-term bullish signal. The reverse crossing is a death cross.
Best for: Long-term investors, position traders, and swing traders analyzing broader market structure.
Limitation: The SMA responds slowly to recent price changes. In fast-moving markets this lag can produce late entries and exits.
What is the Exponential Moving Average (EMA)
The EMA applies a multiplier that gives more weight to recent prices. The smoothing factor is based on the period length: the shorter the period, the more weight the most recent price receives.
This makes the EMA faster to react to price changes than the SMA, which is why short-term and swing traders prefer it. The tradeoff is greater sensitivity to price noise and more frequent false signals in choppy, range-bound markets.
Common EMA Settings
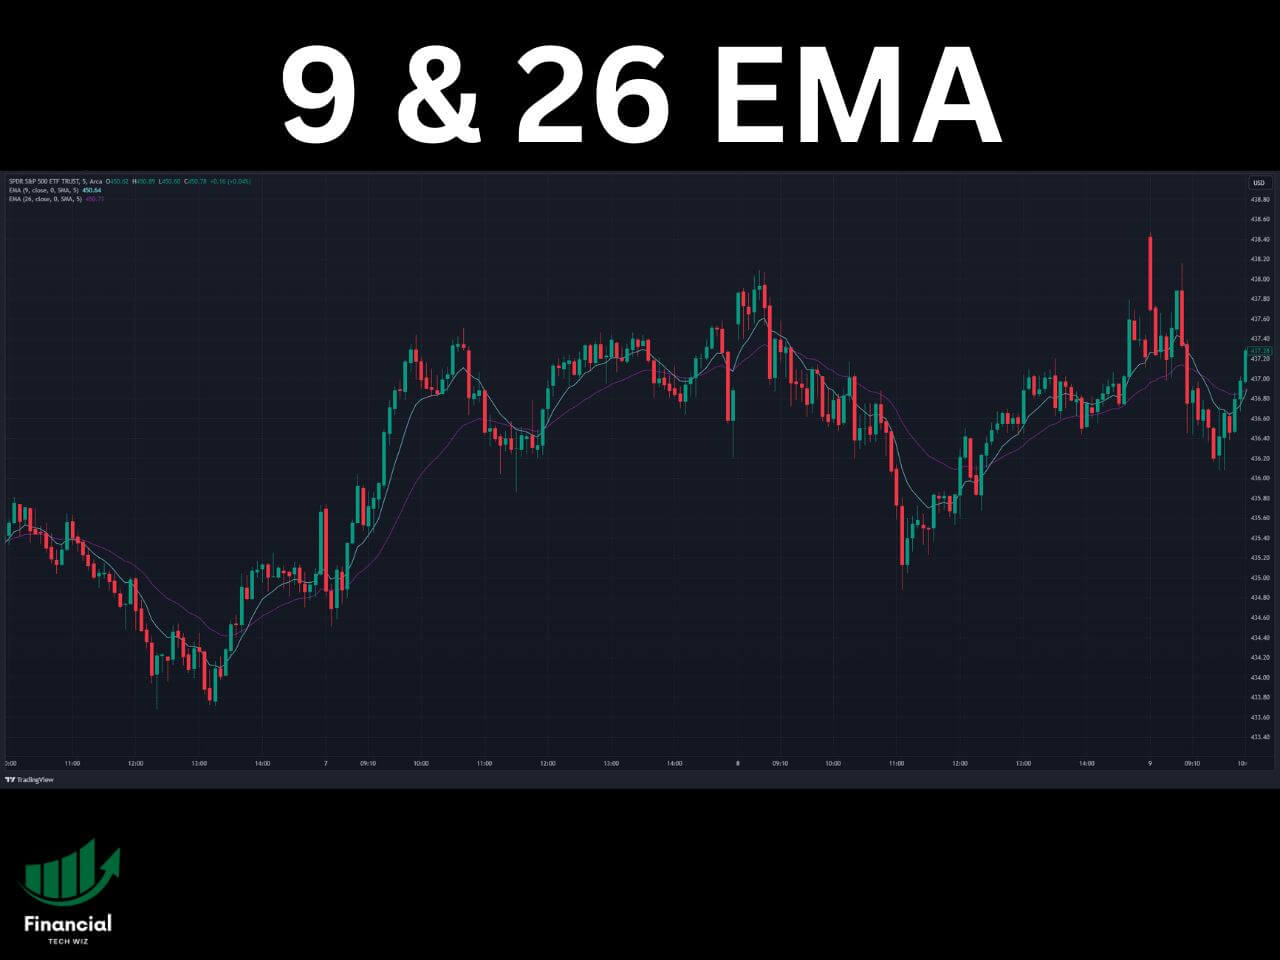
- 9 EMA: popular with day traders for identifying short-term momentum
- 21 EMA: common swing trading reference point
- 12 and 26 EMA: the basis of the MACD indicator
When the 9-EMA crosses above the 26-EMA on an intraday chart, many traders treat this as a short-term bullish crossover signal. You can set up these indicators on TradingView using the Moving Average Exponential indicator guide and adjusting the period setting in the indicator settings panel.
Best for: Day traders, scalpers, and short-term swing traders who need faster signals than the SMA provides.
What is the Weighted Moving Average (WMA)
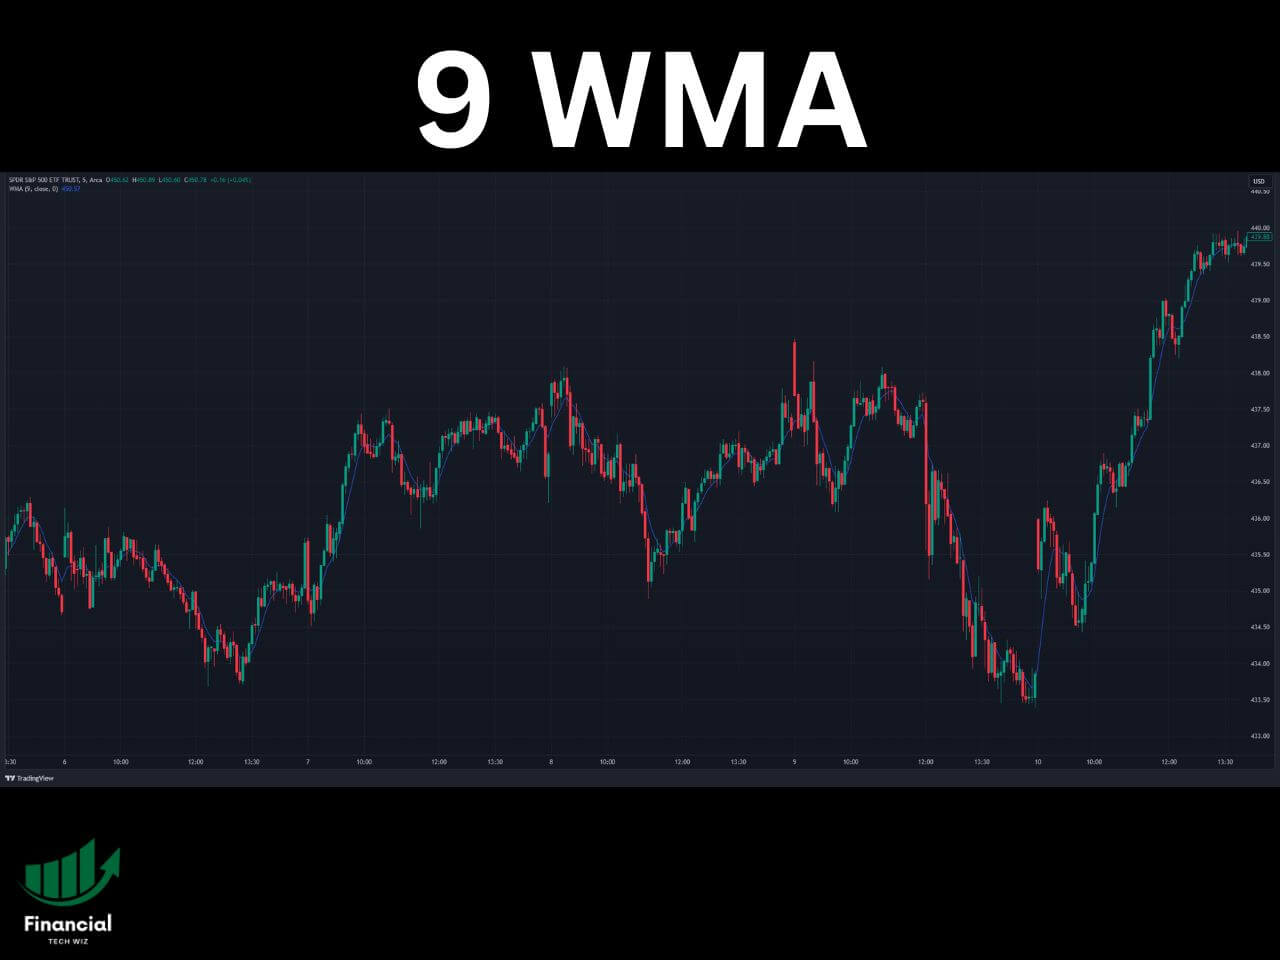
The WMA also prioritizes recent price data but uses a linear weighting system rather than exponential smoothing. The most recent period gets the highest weight, the second most recent gets the next highest, and so on in a straight-line decline.
Formula: WMA = (Price1 x n + Price2 x (n-1) + … + PriceN x 1) / (n x (n+1) / 2)
For a 3-period WMA, the most recent price gets a weight of 3, the second most recent gets 2, and the oldest gets 1. This makes it more responsive than the SMA but generally less reactive than the EMA in fast-moving conditions.
The WMA is considerably less popular than both the SMA and EMA. Most trading platforms support it, but fewer trading strategies are built around it.
Best for: Traders who want a more responsive alternative to the SMA without the full sensitivity of the EMA.
Which Moving Average Is Best for Day Trading?
For day trading, the EMA is the standard choice. The 9-EMA and 21-EMA combination is the most common for intraday entries and exits. Many traders also use the 9-EMA and 26-EMA together.
The reasoning is direct: faster reaction to price changes produces earlier signals, which matters on 1-minute to 15-minute charts where delayed signals mean missed trades or poor fill prices.
If you want to monitor multiple timeframes simultaneously to confirm EMA signals across different time horizons, TradingView’s multiple chart layout feature lets you view up to eight charts on one screen.
For long-term or swing analysis, the SMA remains the more reliable reference because it filters short-term noise better than the EMA.
How to Use Moving Averages to Trade Effectively
Moving averages are pivotal in trading strategies. They can indicate potential buy or sell signals and help in identifying support and resistance levels.
Traders often use two moving averages together for a crossover strategy, where the crossing of a shorter period MA over a longer period MA indicates a potential trend reversal.
The Best Lengths for Moving Averages
The best length for a moving average depends on the trader’s objectives and the market’s volatility.
Short-term traders might prefer shorter periods, like 5 or 10 days, for more sensitivity, while long-term investors might opt for 50 or 200 days to filter out market noise.
Additionally, long-term traders may prefer SMAs, while short-term traders may prefer EMAs since they use more recent price data.
How to Access Moving Averages on TradingView
TradingView supports all three moving average types. To add them to a chart:
- Open a chart and click the Indicators button at the top of the chart
- Search for Moving Average Simple, Moving Average Exponential, or Moving Average Weighted
- Select the indicator and adjust the period in the settings panel
TradingView’s free plan includes access to all standard moving average indicators. If you have not used TradingView before, you can review what the free plan includes here: TradingView Free Trial Overview.
For a broader look at indicators that work well alongside moving averages, this guide covers the most effective options: Best TradingView Indicators.
Disclaimer: Financial Tech Wiz is a TradingView affiliate and may be compensated if you use our links to sign up or purchase a TradingView subscription.
MA vs. EMA vs. SMA vs. WMA – Bottom Line
Each moving average – MA, EMA, SMA, and WMA – has its unique features and applications. Which you should use depends on your strategy, the time frame of trading, and the specific market conditions.
Understanding these differences is key to employing these tools effectively in trading scenarios.
If you’d like to get better at technical analysis, you should create a free TradingView account to analyze all markets within a single platform.
If you sign up for TradingView using my link, you will also get a discount on your subscription if you choose to upgrade to a premium plan.
Disclaimer: Financial Tech Wiz is a TradingView affiliate and will be compensated if you use our link to purchase a TradingView subscription.
Frequently Asked Questions
What is the difference between SMA and EMA?
The SMA assigns equal weight to all price data in the period. The EMA gives more weight to recent prices using an exponential multiplier. This makes the EMA faster to react to price changes and more useful for short-term trading, while the SMA is better suited to long-term trend analysis where stability matters more than speed.
Which moving average is best for swing trading?
Most swing traders use the EMA, particularly the 21-EMA or a combination of the 9 and 21 EMAs. The EMA’s faster response gives swing traders earlier entry and exit signals compared to the SMA. Many swing traders also use the 50-day SMA as a broader trend reference alongside shorter-period EMAs.
Is WMA better than EMA?
In most cases, no. The WMA uses linear weighting while the EMA uses exponential weighting, which typically makes the EMA more responsive in fast-moving markets. The WMA is rarely used as a primary indicator. Most traders default to the EMA when they want a faster, recency-weighted moving average.
Get Your Free Trading Resources
Grab the free trading journal template plus the same tools we use to stay organized, consistent, and objective.
- Free trading journal template
- Custom indicators, watchlists, and scanners
- Access our free trading community
Enter your email below to get instant access.
No spam. Unsubscribe anytime.


