
Weekly Market Update Into July 13th: SPY Is 1% From All-Time Highs

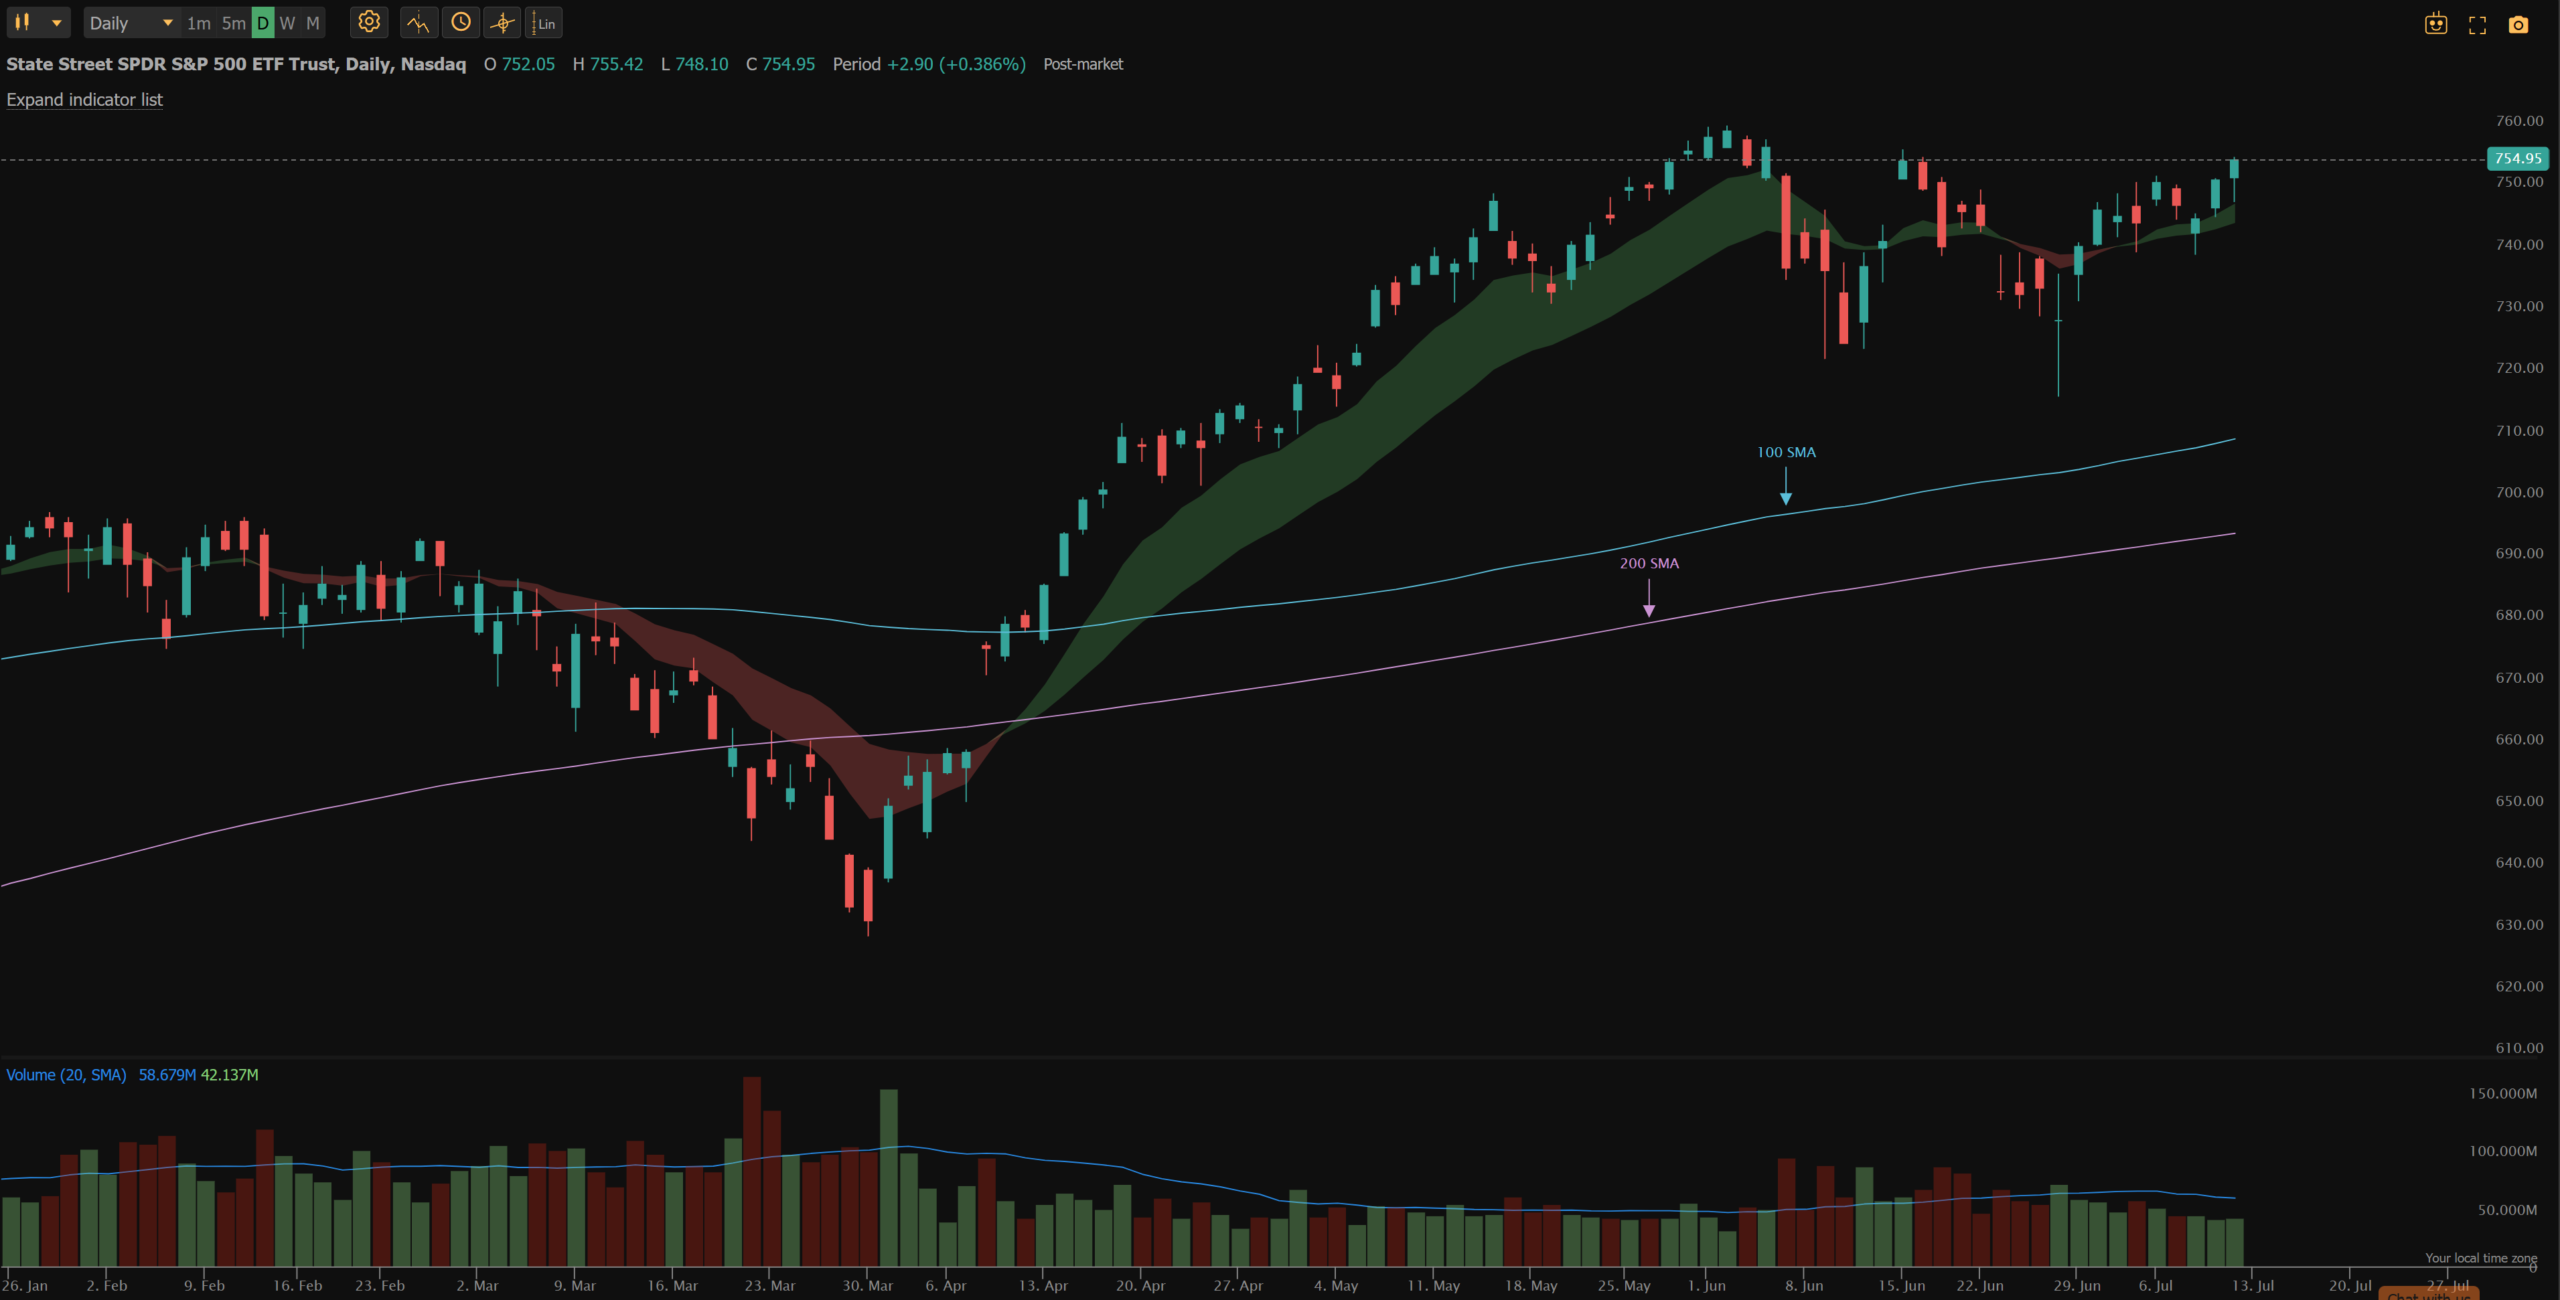
SPY closed out another green week and now sits within 1% of its all-time high. The headline risk was real: the U.S.-Iran ceasefire fell apart midweek and oil ripped, then faded into Friday once Trump floated a return to the negotiating table and risk appetite came back. On the Fed side, Wednesday’s June FOMC minutes read hawkish, with officials pointing to tariffs, the Middle East conflict, and AI-driven demand as reasons inflation is running hotter than they want. The week also brought SK Hynix to the Nasdaq as an ADR, a big moment for the Korean memory giant. SPY is holding comfortably above both its 100-day and 200-day SMAs, keeping the bullish trend intact and the daily pivot scanner entries active. Most of the fresh money went to energy (XLE) and tech (XLK).
Looking ahead, the calendar heats up. NFLX unofficially kicks off earnings season as one of the first big names to report, and a consumer sentiment print lands as well. The main events are CPI and PPI midweek, handing the market a fresh inflation read right as a lineup of Fed speakers works to shape rate expectations. View the full economic calendar here.
Current Watchlist
Keep in mind that nothing I say or do should be considered financial advice, but you can see the constantly updated swing watchlist here. The watchlist lives inside the leaderboard where any journal user can submit their own portfolio for everyone to see. These are the daily pivot breakout plays I am personally in, based on the strategy.
It was a relatively slow week on the book, and honestly I did not see a ton of setups I loved. Two trailing stops hit: NVT closed for a -14.41% loss and FIX closed for a +2.48% gain. With that capital freed up I opened new positions in HIMS, CRWD, HOOD, and RBRK to build more exposure to healthcare and cybersecurity, two of those straight off recent scan results. My top three performers last week:
- RSI +3.41%
- VRT +2.59%
- ADI +2.11%
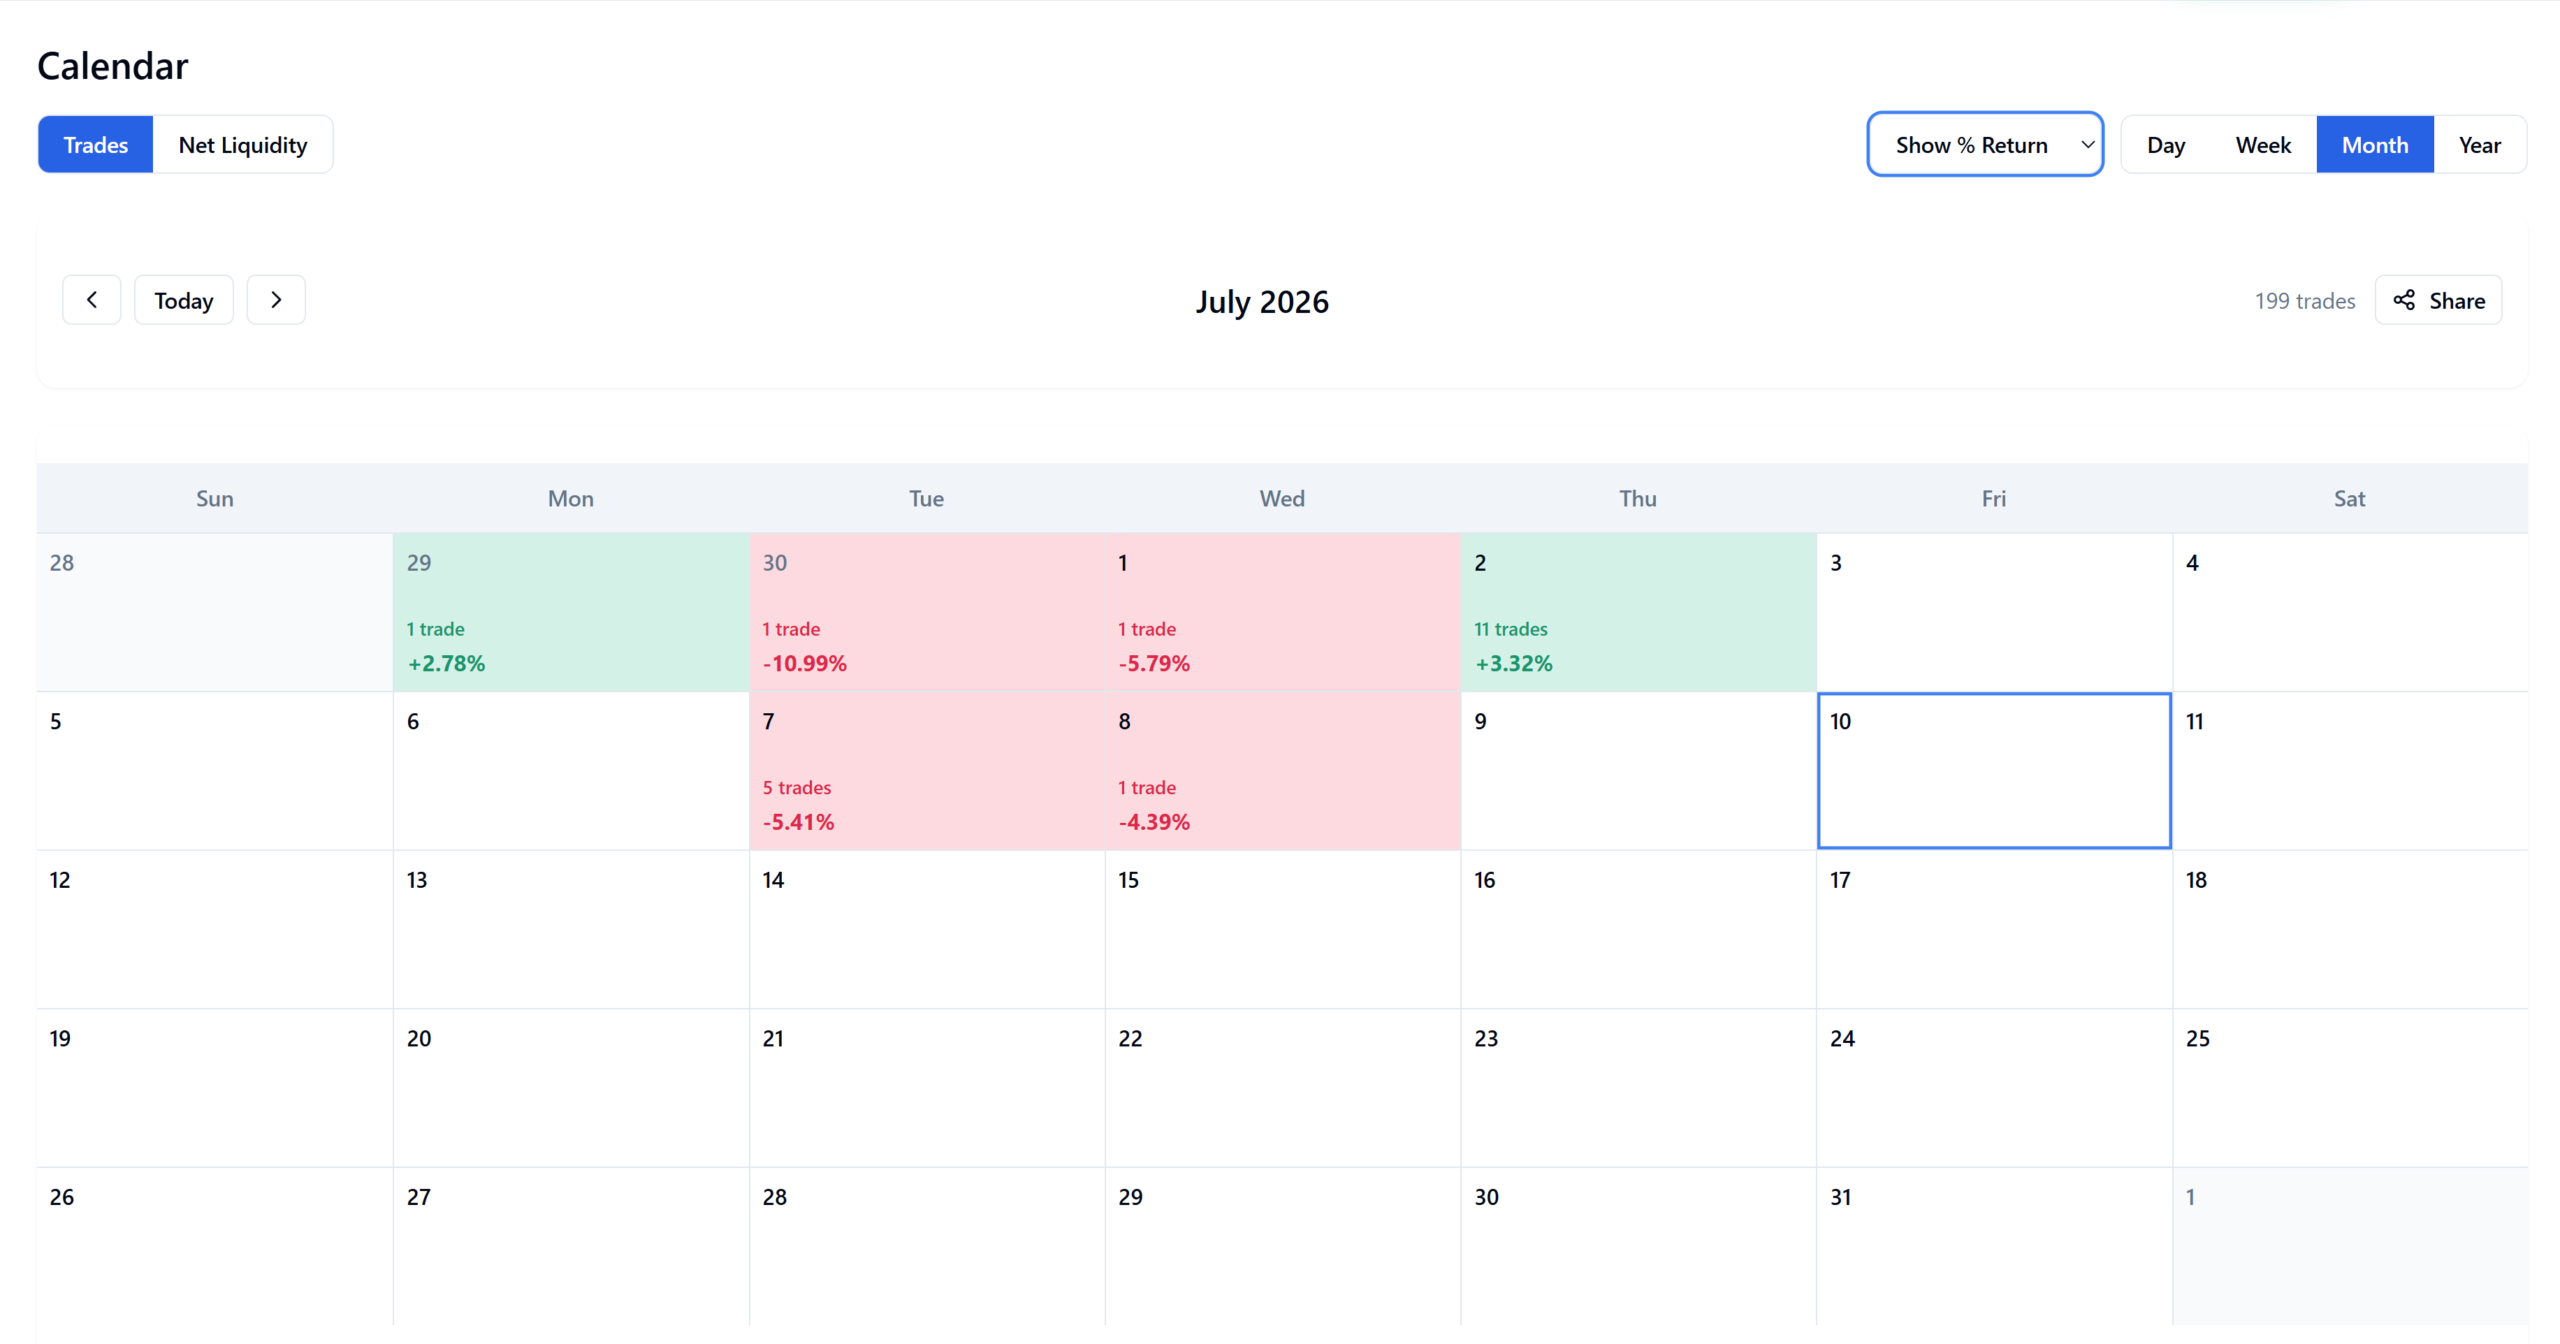
Every entry, exit, and the running P&L lives in the Financial Tech Wiz Trading Journal, which is exactly how I know a slow week still nets out fine instead of just feeling like it did. Here is a full walkthrough of the journal app:

Top 3 Daily Pivot Scan Results
Want every daily pivot breakout play in real time?
These setups came from the scanners that post plays every evening in our premium Discord. Membership gets you every play as it fires, the premium scanner channels, and the Financial Tech Wiz Trading Journal to log your trades and track your progress.
Start your 7-day free trial$19/month or $119/year after the trial. Cancel anytime.
NTAP (NetApp)
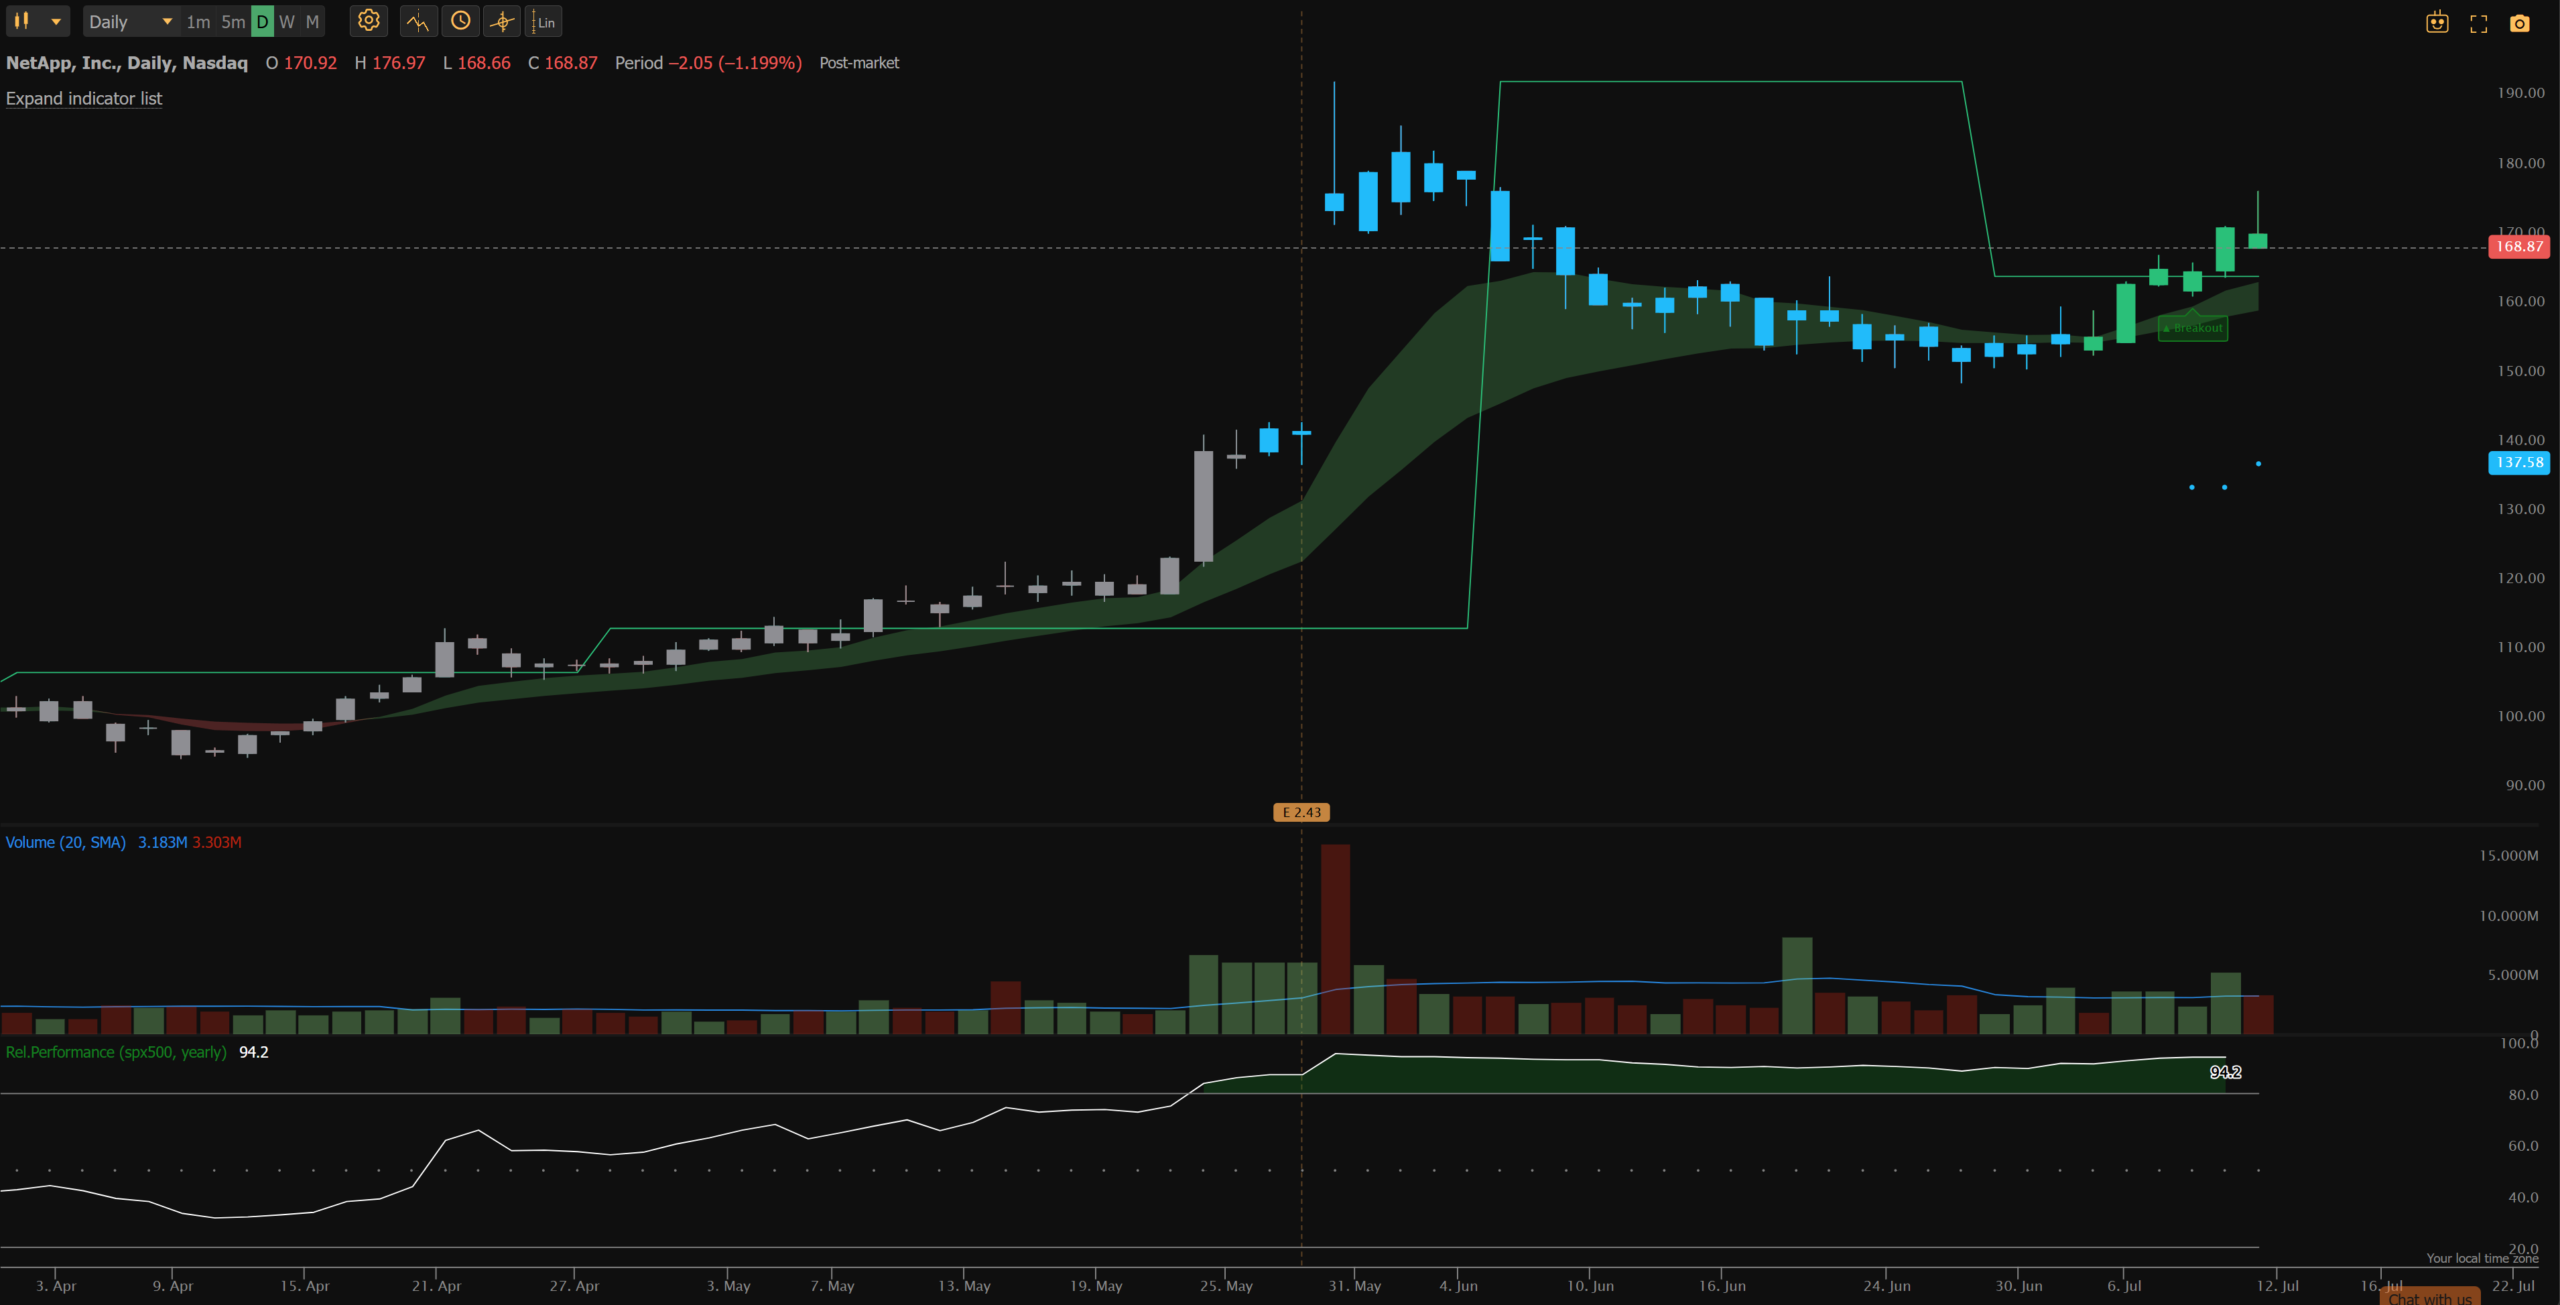
- Daily pivot breakout on 7/7/26. After a big power earnings gap, price came back to test the bottom of the gap, held it as support, and broke out as the momentum candles flipped green.
- Bull case: Category leader in enterprise data storage with a real AI data-infrastructure angle; growth is accelerating (revenue up roughly 12-15% YoY, EPS up about 23% YoY) with net margins near 21% and gross margins above 70%, quality economics.
- Bear case: Underlying growth is still only high-single to low-double digit for a mature name, the weekly chart is extended (about 40% above the 200-day after a near-90% run), and insiders are selling into it (the President sold about $7.7M), so risk/reward for fresh capital is poor.
AMD (Advanced Micro Devices)
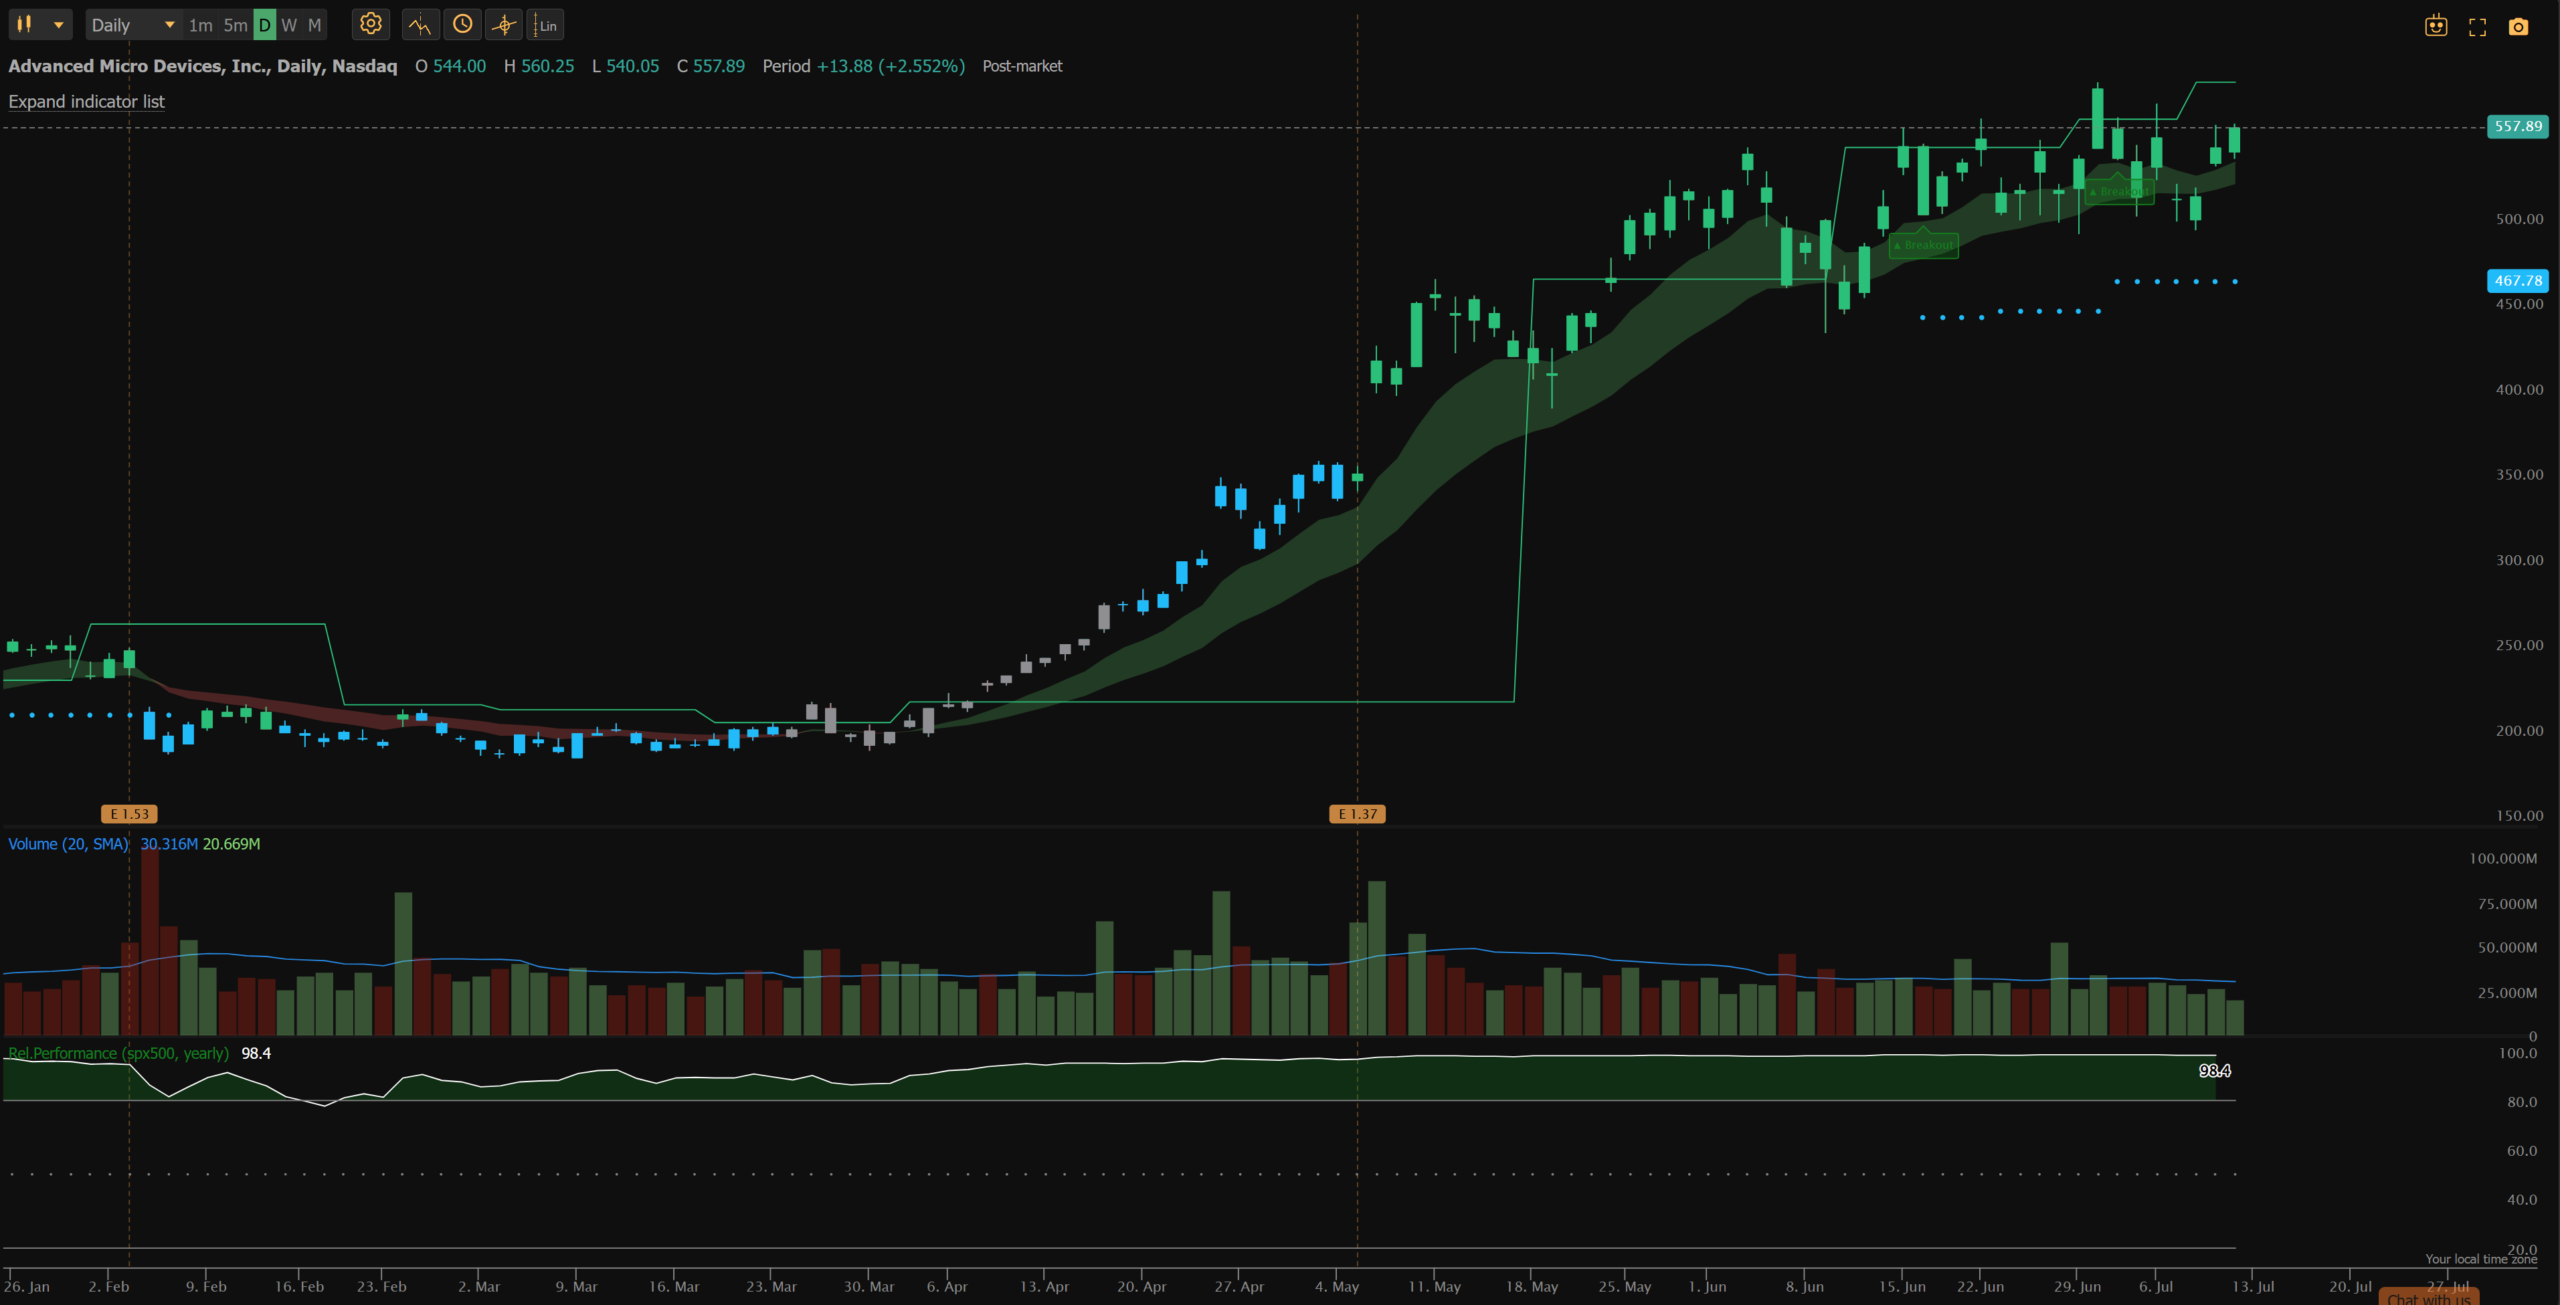
- Daily pivot breakout on 6/30/26. Relative performance has held above 90 for a full year, and the momentum candles have been green since the bullish power earnings gap on its May report.
- Bull case: Best-in-class fundamentals with revenue accelerating about 39% YoY and EPS up about 92%, margins expanding from 9.5% to 13.5%, the prime AI datacenter theme, and clear #2 accelerator leadership behind Nvidia; relative strength around 98.
- Bear case: The weekly is parabolic and extended (roughly 74% above the 40-week SMA after tripling), and the C-suite is selling hard (CEO Lisa Su around $113M), so fresh money here is chasing a stretched leg rather than entering early in the trend.
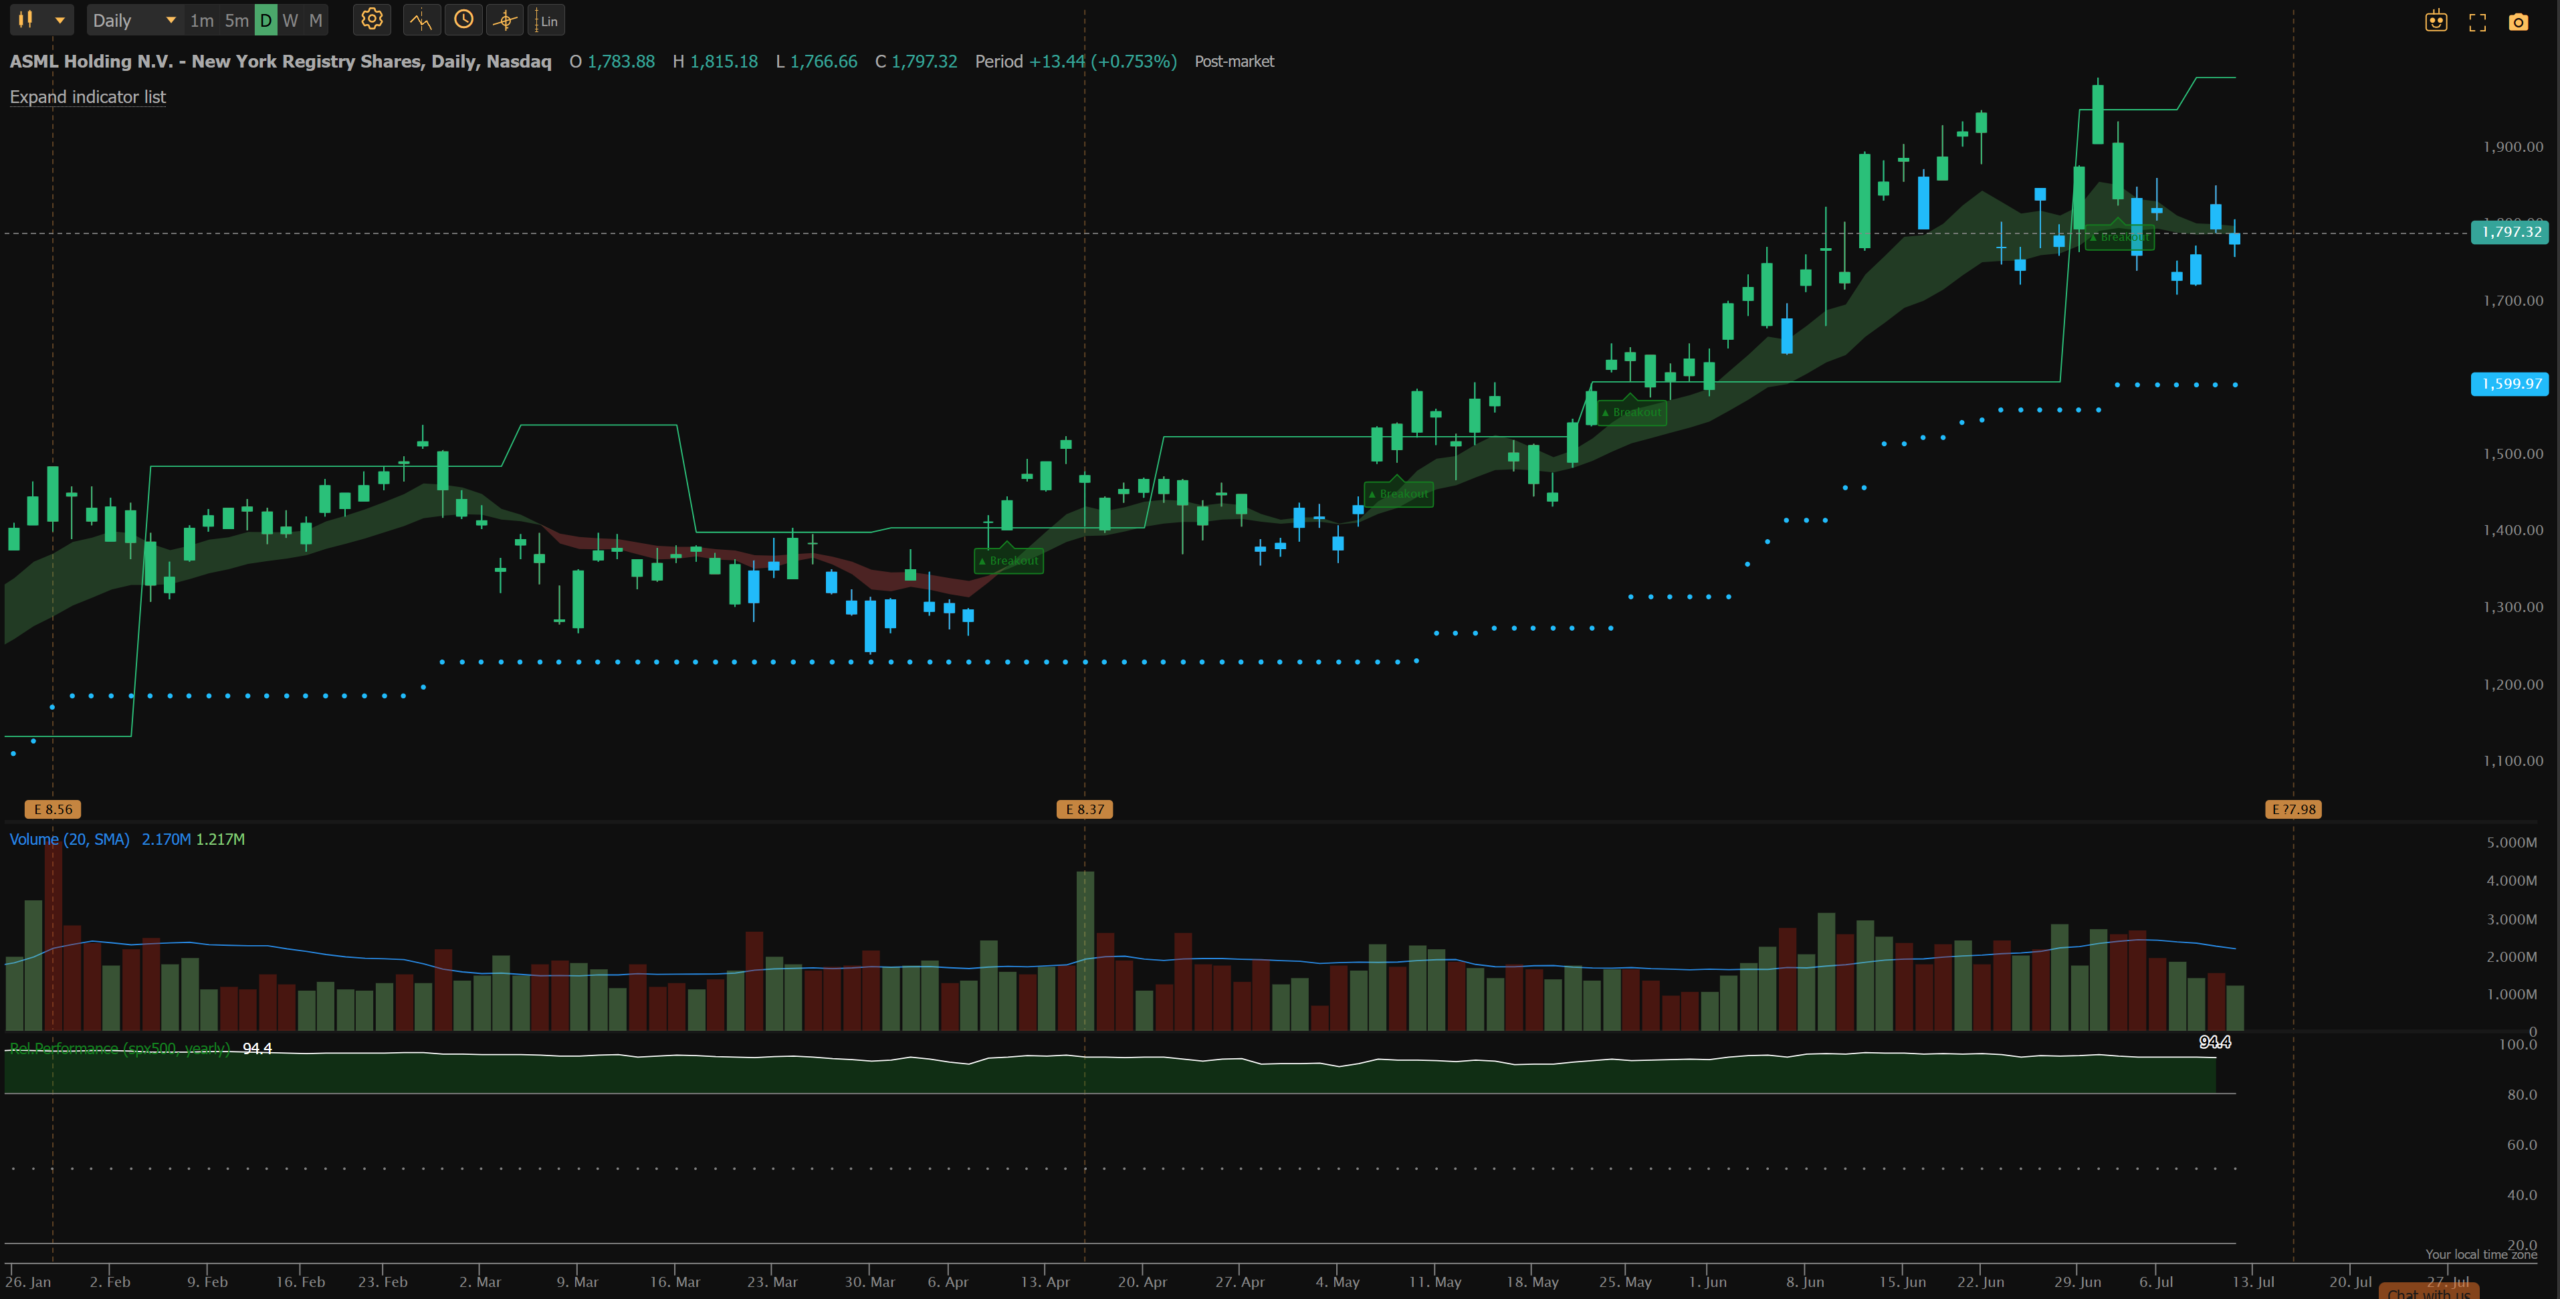
ASML (ASML Holding)
- Daily pivot breakout on 6/30/26. Relative performance has held above 90 since September 2025 while price rides a green weekly 9/21 EMA cloud higher the whole way.
- Bull case: Effective monopoly on EUV and the sole High-NA supplier, the critical bottleneck for leading-edge AI chips; growth re-accelerated last quarter (revenue +26% YoY, EPS +32.7%) with positive operating leverage and clear institutional accumulation (FMR added about $2.0B).
- Bear case: Order-driven revenue is lumpy with real geopolitical and export-control exposure, and the weekly is extended (about 30% above the 40-week SMA and already gave back roughly 11% off the peak), so risk/reward for new money is only average.
Want the full breakdown?
This is the short version. Every Sunday my free newsletter goes deeper with the full sector rotation map, the high-momentum names driving each sector, and the exact daily pivot strategy rules I trade. Drop your email below and you will get the next one.
Resources
- Join the free Financial Tech Wiz Discord
- The daily pivot breakout scanner and indicator I use on TrendSpider
- The Financial Tech Wiz Trading Journal
- The free trading journal template
Get Your Free Trading Resources
Grab the free trading journal template plus the same tools we use to stay organized, consistent, and objective.
- Free trading journal template
- Custom indicators, watchlists, and scanners
- Access our free trading community
Enter your email below to get instant access.
No spam. Unsubscribe anytime.







