
Weekly Market Update Into July 6th: Chips Cracked, the Index Held

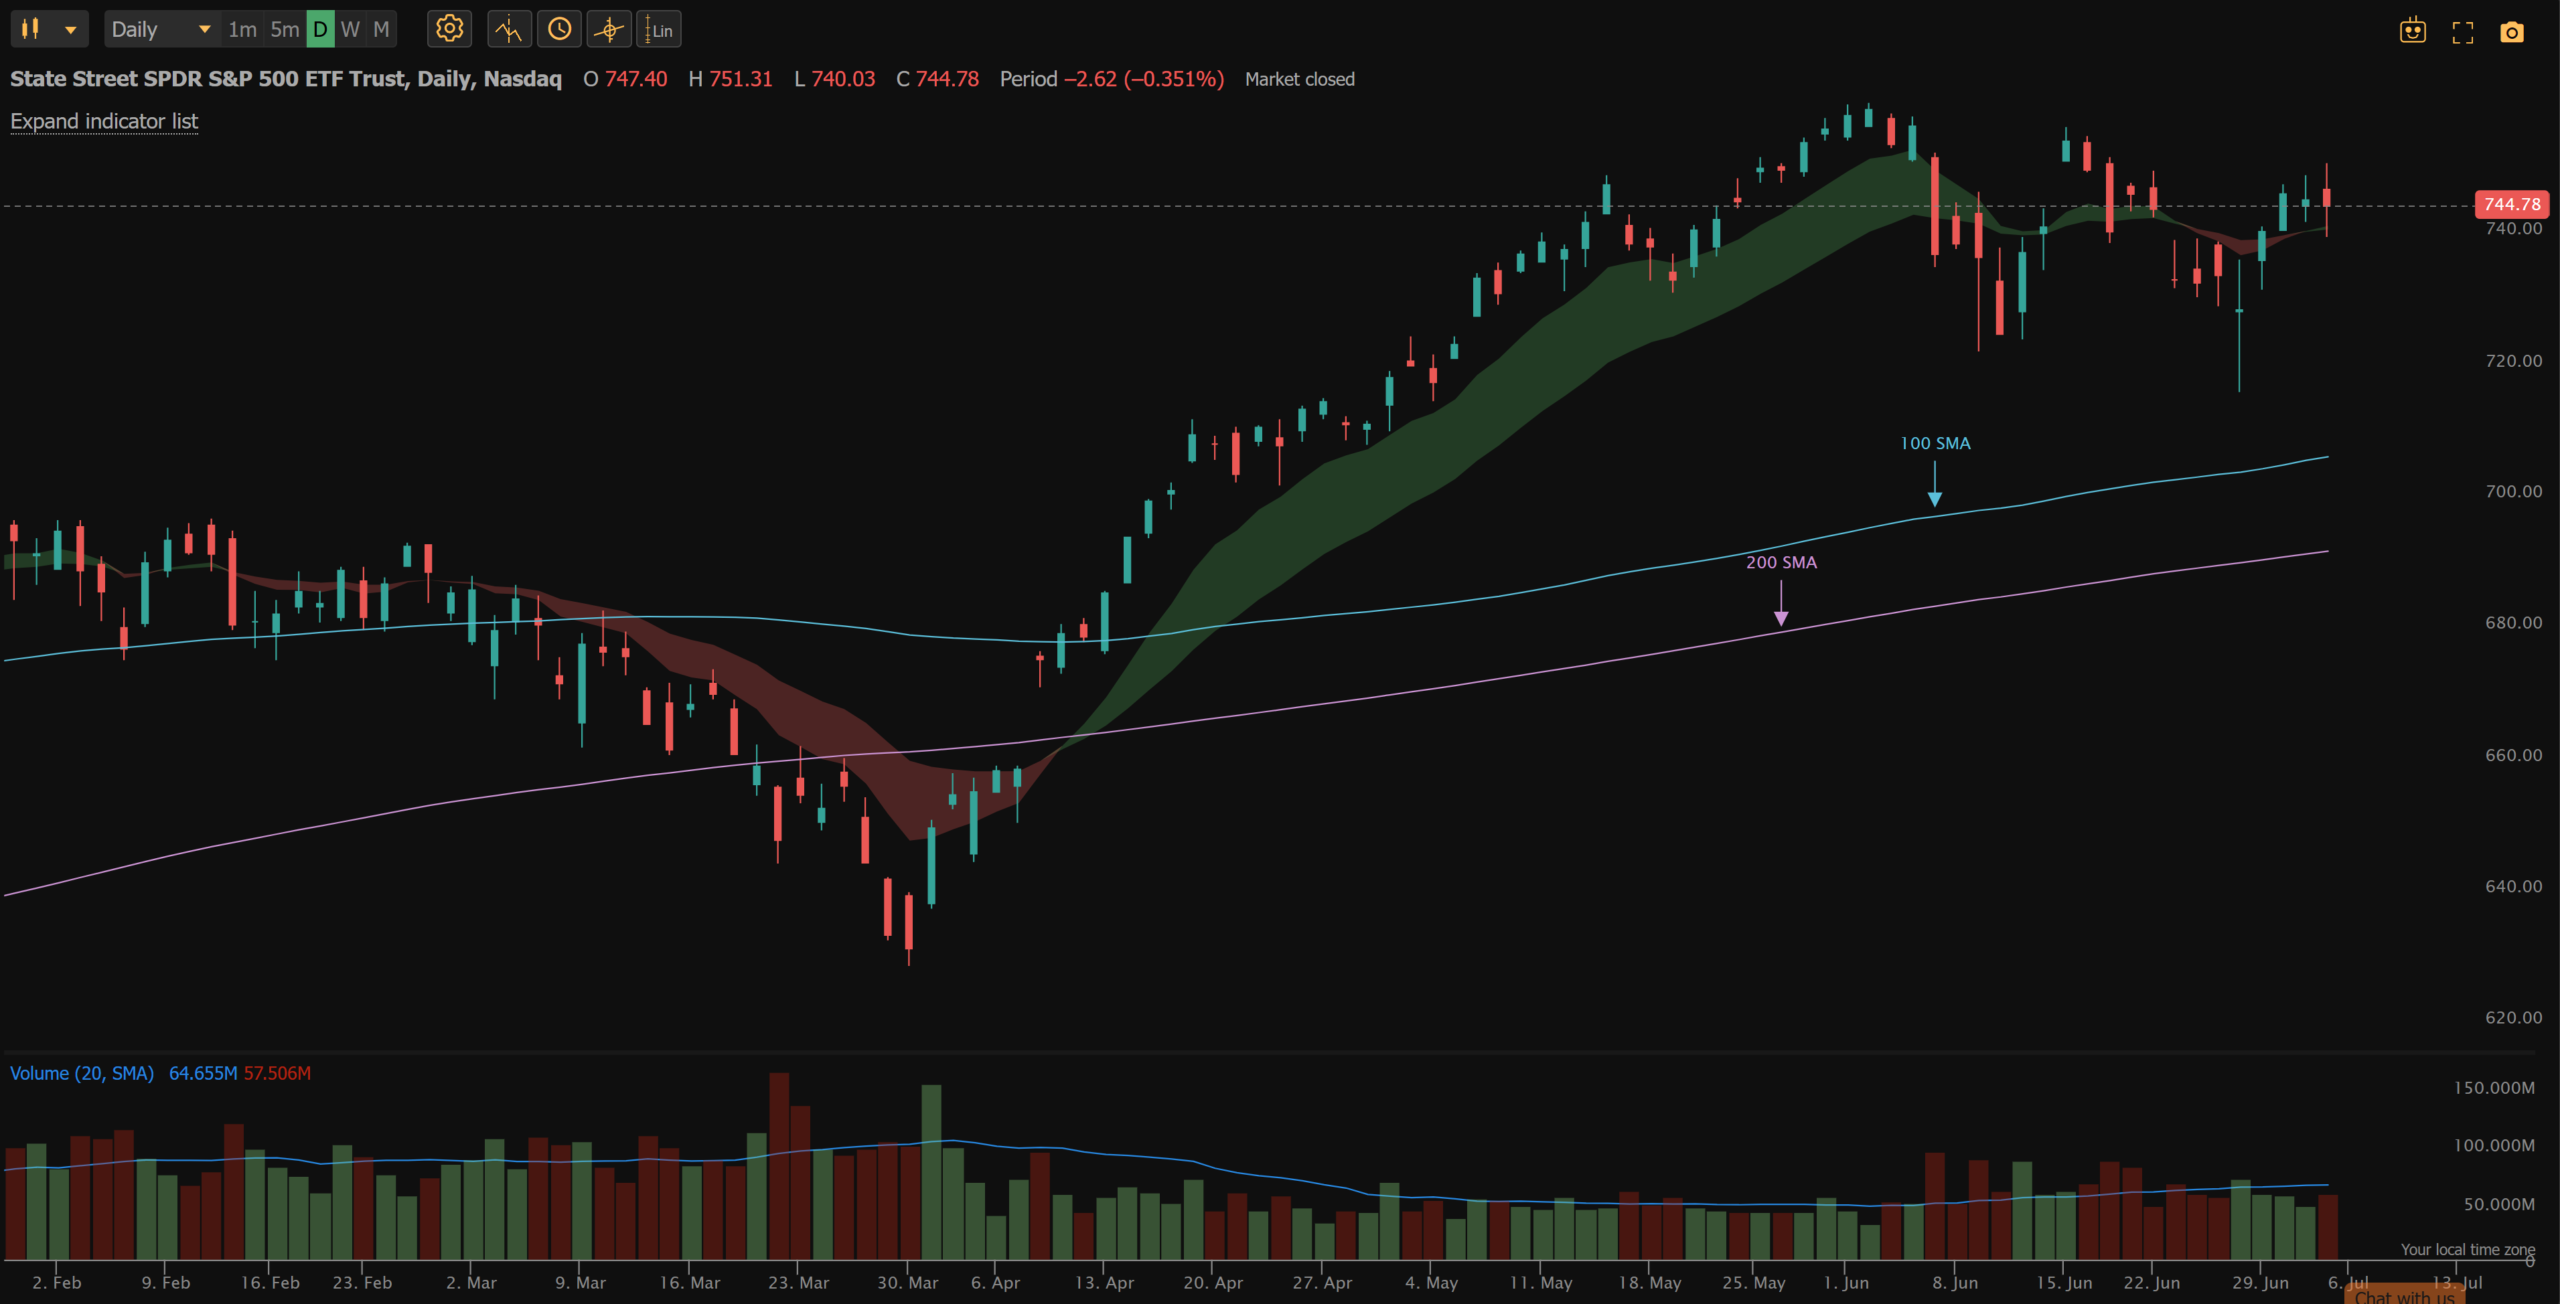
Markets chopped all week and finished mostly flat at the index level, though under the surface it was anything but calm. SPY still managed to close up about 2% while the tech-heavy QQQ lagged with a gain under 1%. The real damage was in semiconductors, where memory names like Micron (MU) took heat from a mix of profit taking and a weak Friday jobs number. Meta’s new plan to sell off its excess AI compute added fuel, hitting neocloud stocks like Nebius (NBIS) hard and bleeding into the broader semi space. Even with the rotation, SPY is still holding above its 100-day and 200-day SMAs, so the regime filter stays on and new entries remain valid.
Looking ahead, the calendar is light with FOMC minutes on Wednesday as the one event worth watching for any read on the rate path. Outside of that it should be a relatively quiet week, so price action and the ongoing rotation will likely drive the tape more than headlines. As always, stay alert to any surprise war or policy headlines that can swing this market either direction. View the full economic calendar here.
Top 3 Daily Pivot Scan Results
How I find these setups
I run a daily pivot breakout scanner on TrendSpider to catch fresh momentum breakouts before they move. Here are the three setups it flagged this week.
See the TrendSpider scanner I useHIMS (Hims & Hers Health)
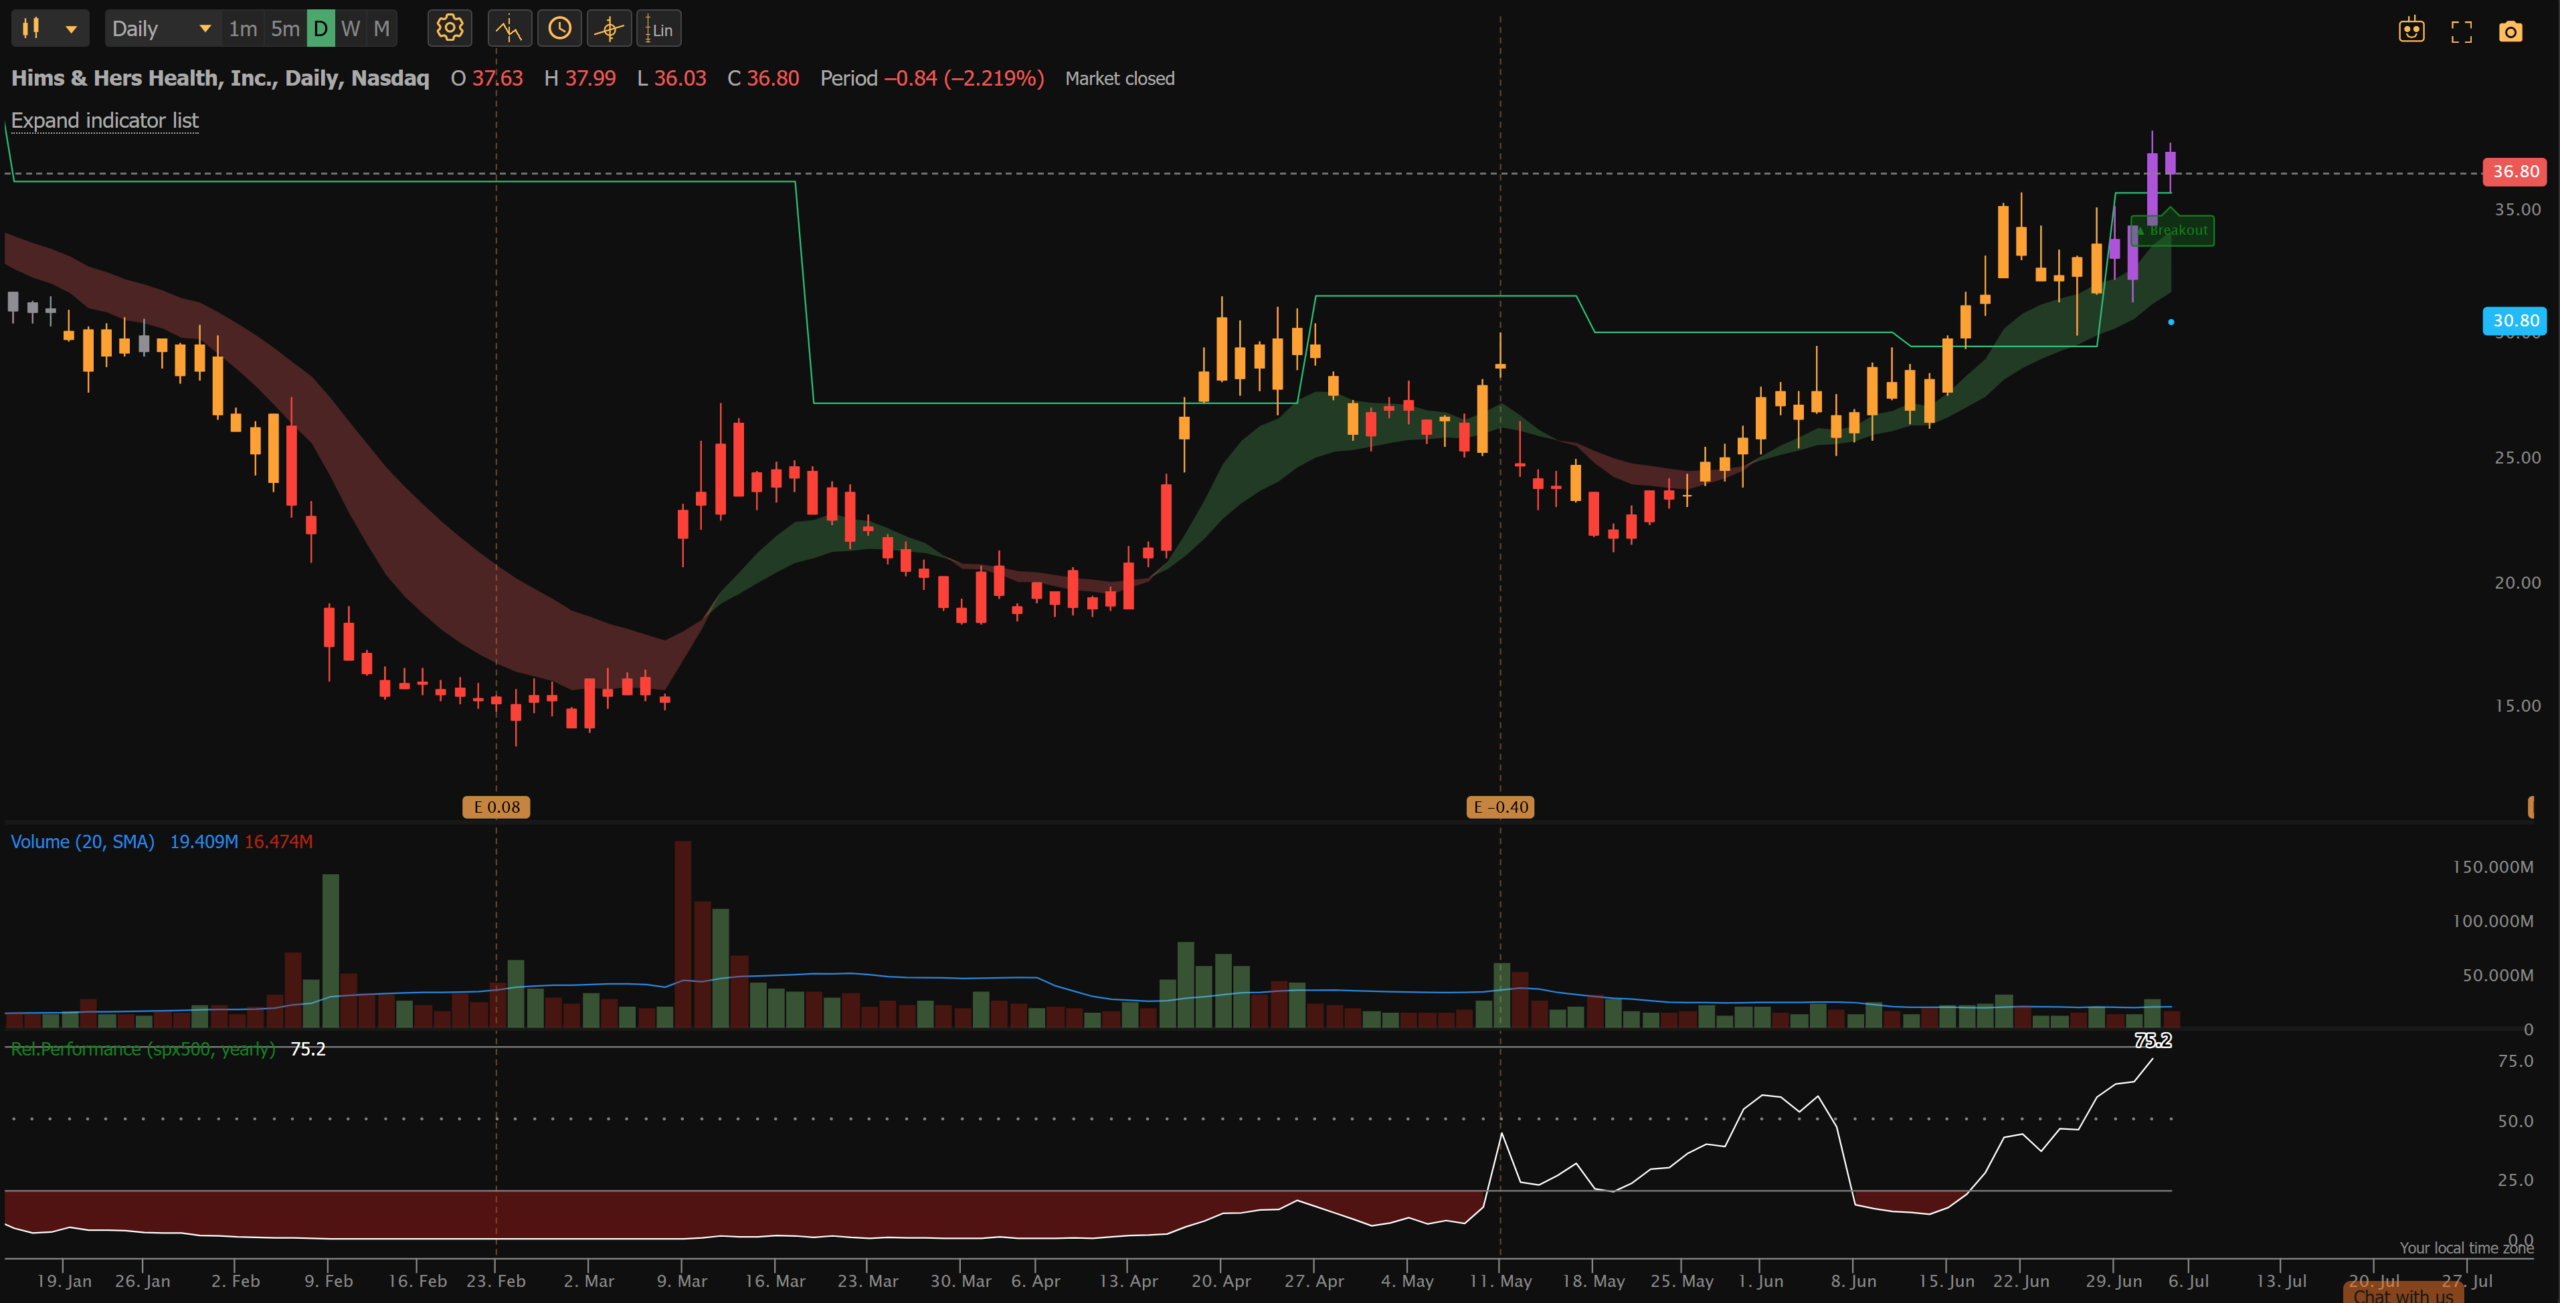
- Daily pivot breakout on 7/1/26. Relative performance ripped from sub-10 to 75 in just a couple of weeks.
- Bull case: Historically a fast top-line grower (+70% to +110% YoY through 2025) with roughly 65-80% gross margins and a strong brand in the telehealth and GLP-1 weight-loss theme.
- Bear case: Growth has collapsed to +3.8% revenue YoY in Q1’26 with a swing to a -$0.40 EPS loss and negative free cash flow, and with a regulatory GLP-1 overhang and another loss estimated next quarter it is the highest-risk name of the three.
RDDT (Reddit)
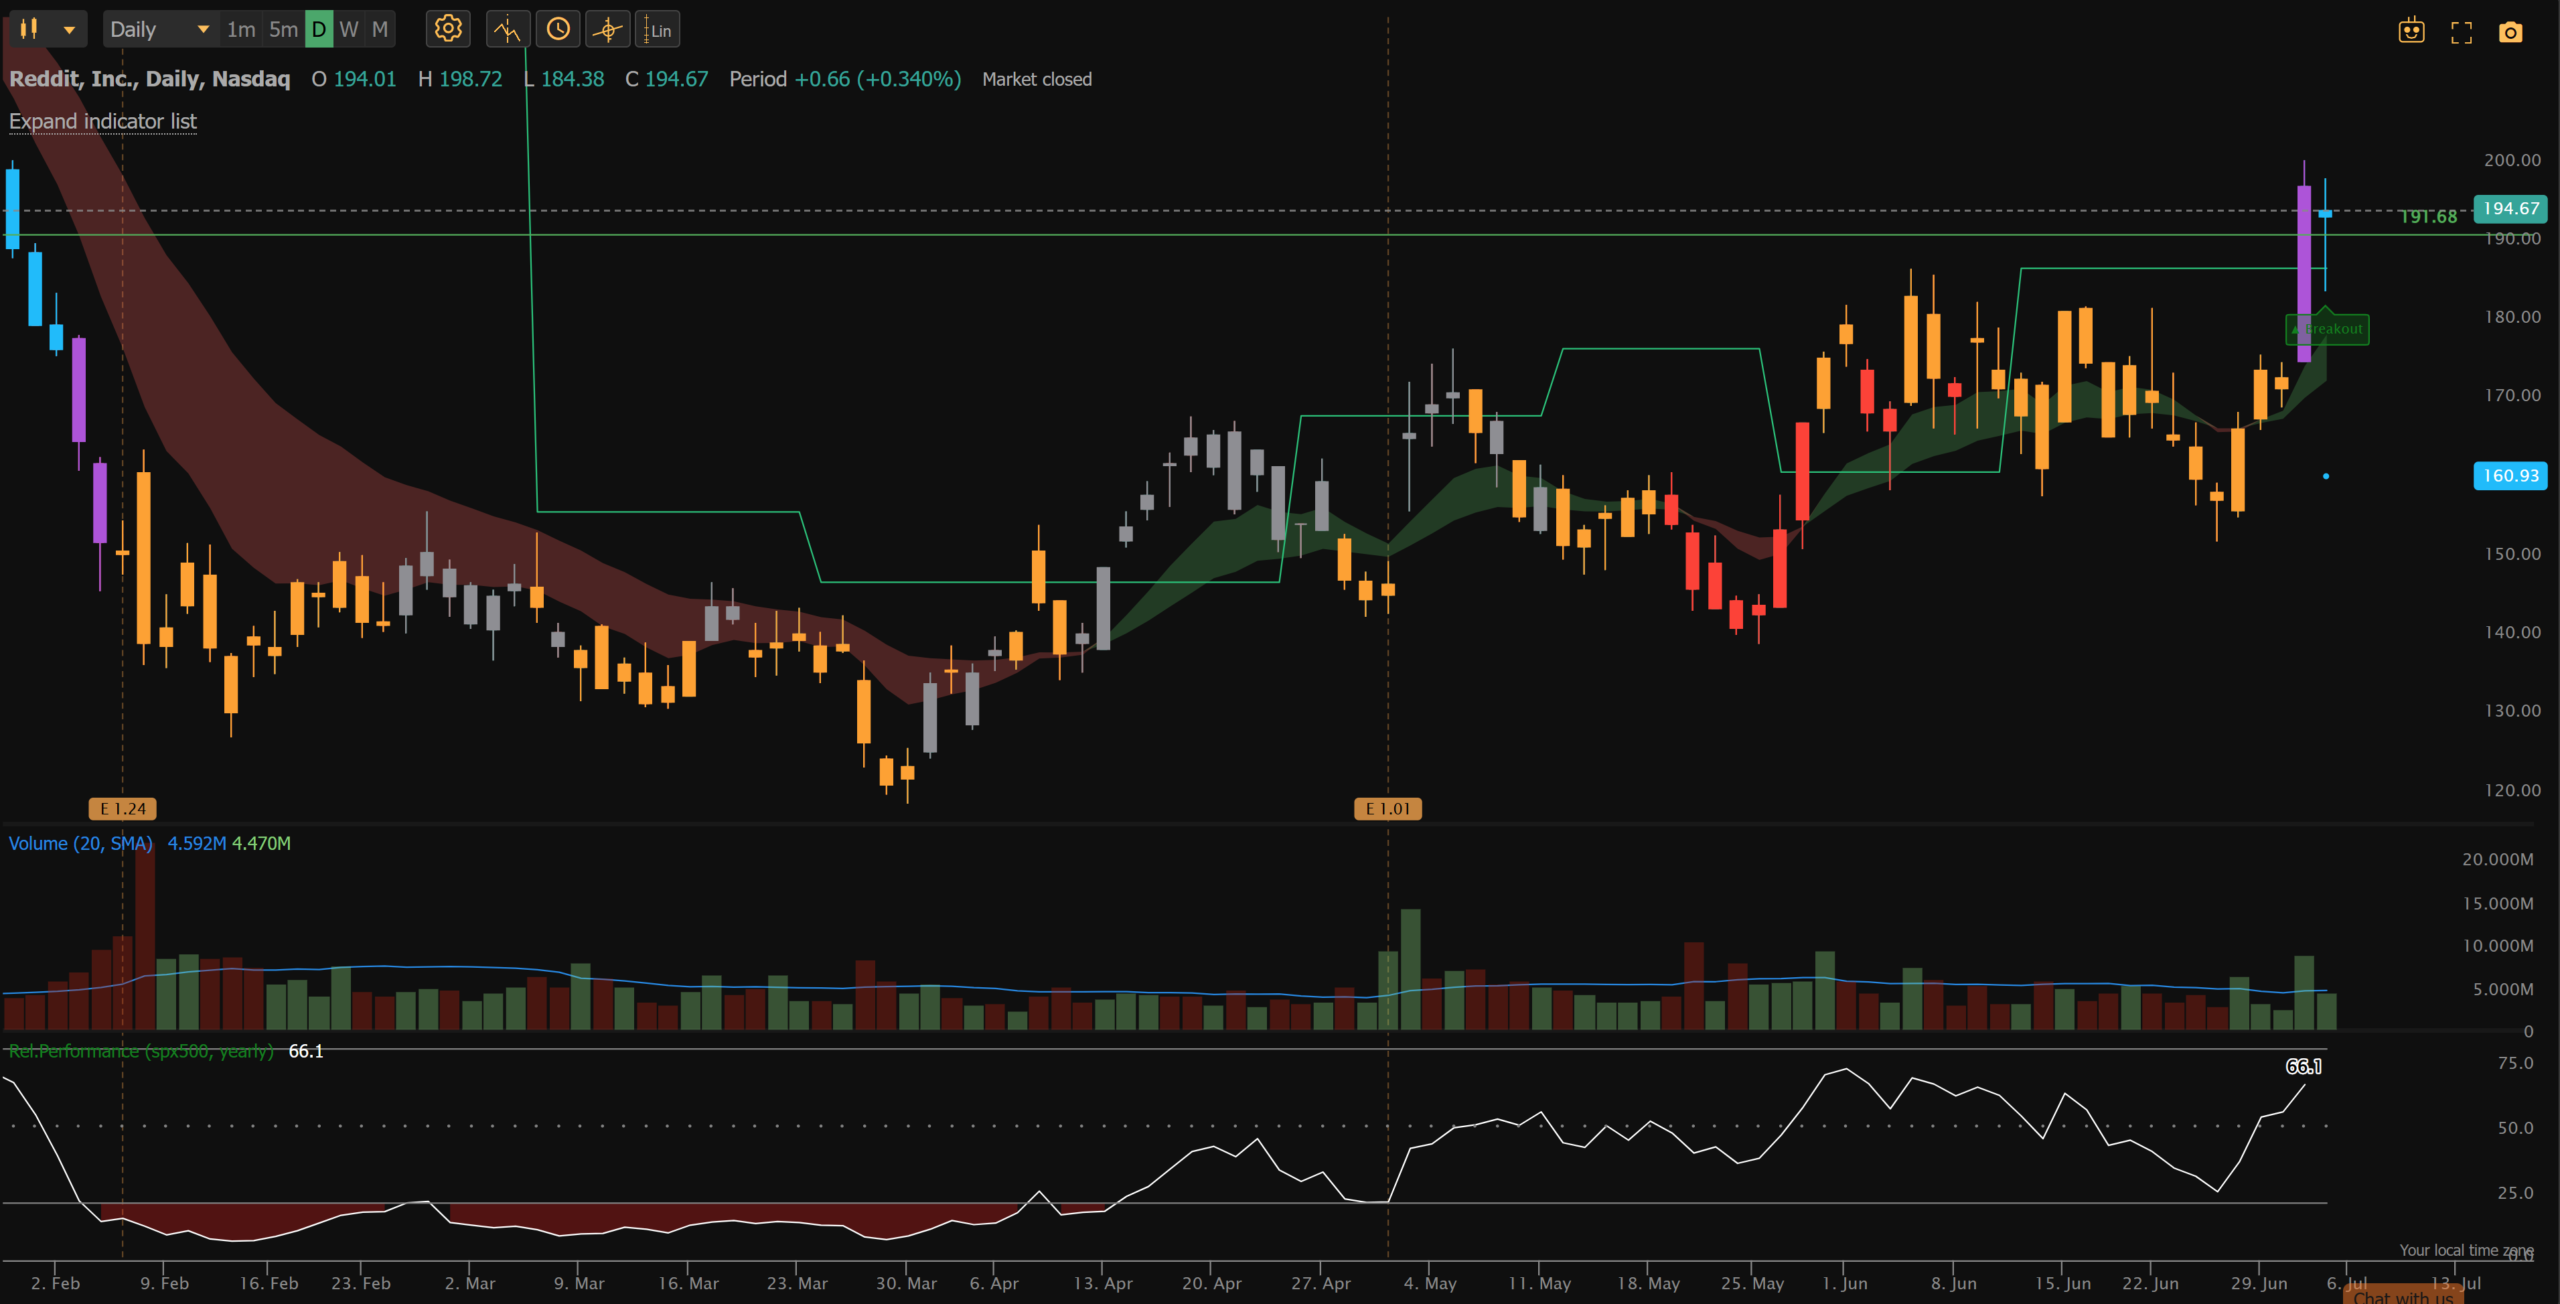
- Daily pivot breakout on 7/1/26, firing on a purple momentum candle after a roughly 50% correction, then turning blue the next day as momentum strengthened.
- Bull case: Revenue has grown around 69% YoY for six straight quarters with gross margins near 90%, and the AI data-licensing story is still very much intact.
- Bear case: Heavily dependent on ad revenue and Google search traffic, with growth decelerating off huge comps and a valuation that prices in perfection, and 7/30 earnings are a binary risk.
HOOD (Robinhood Markets)
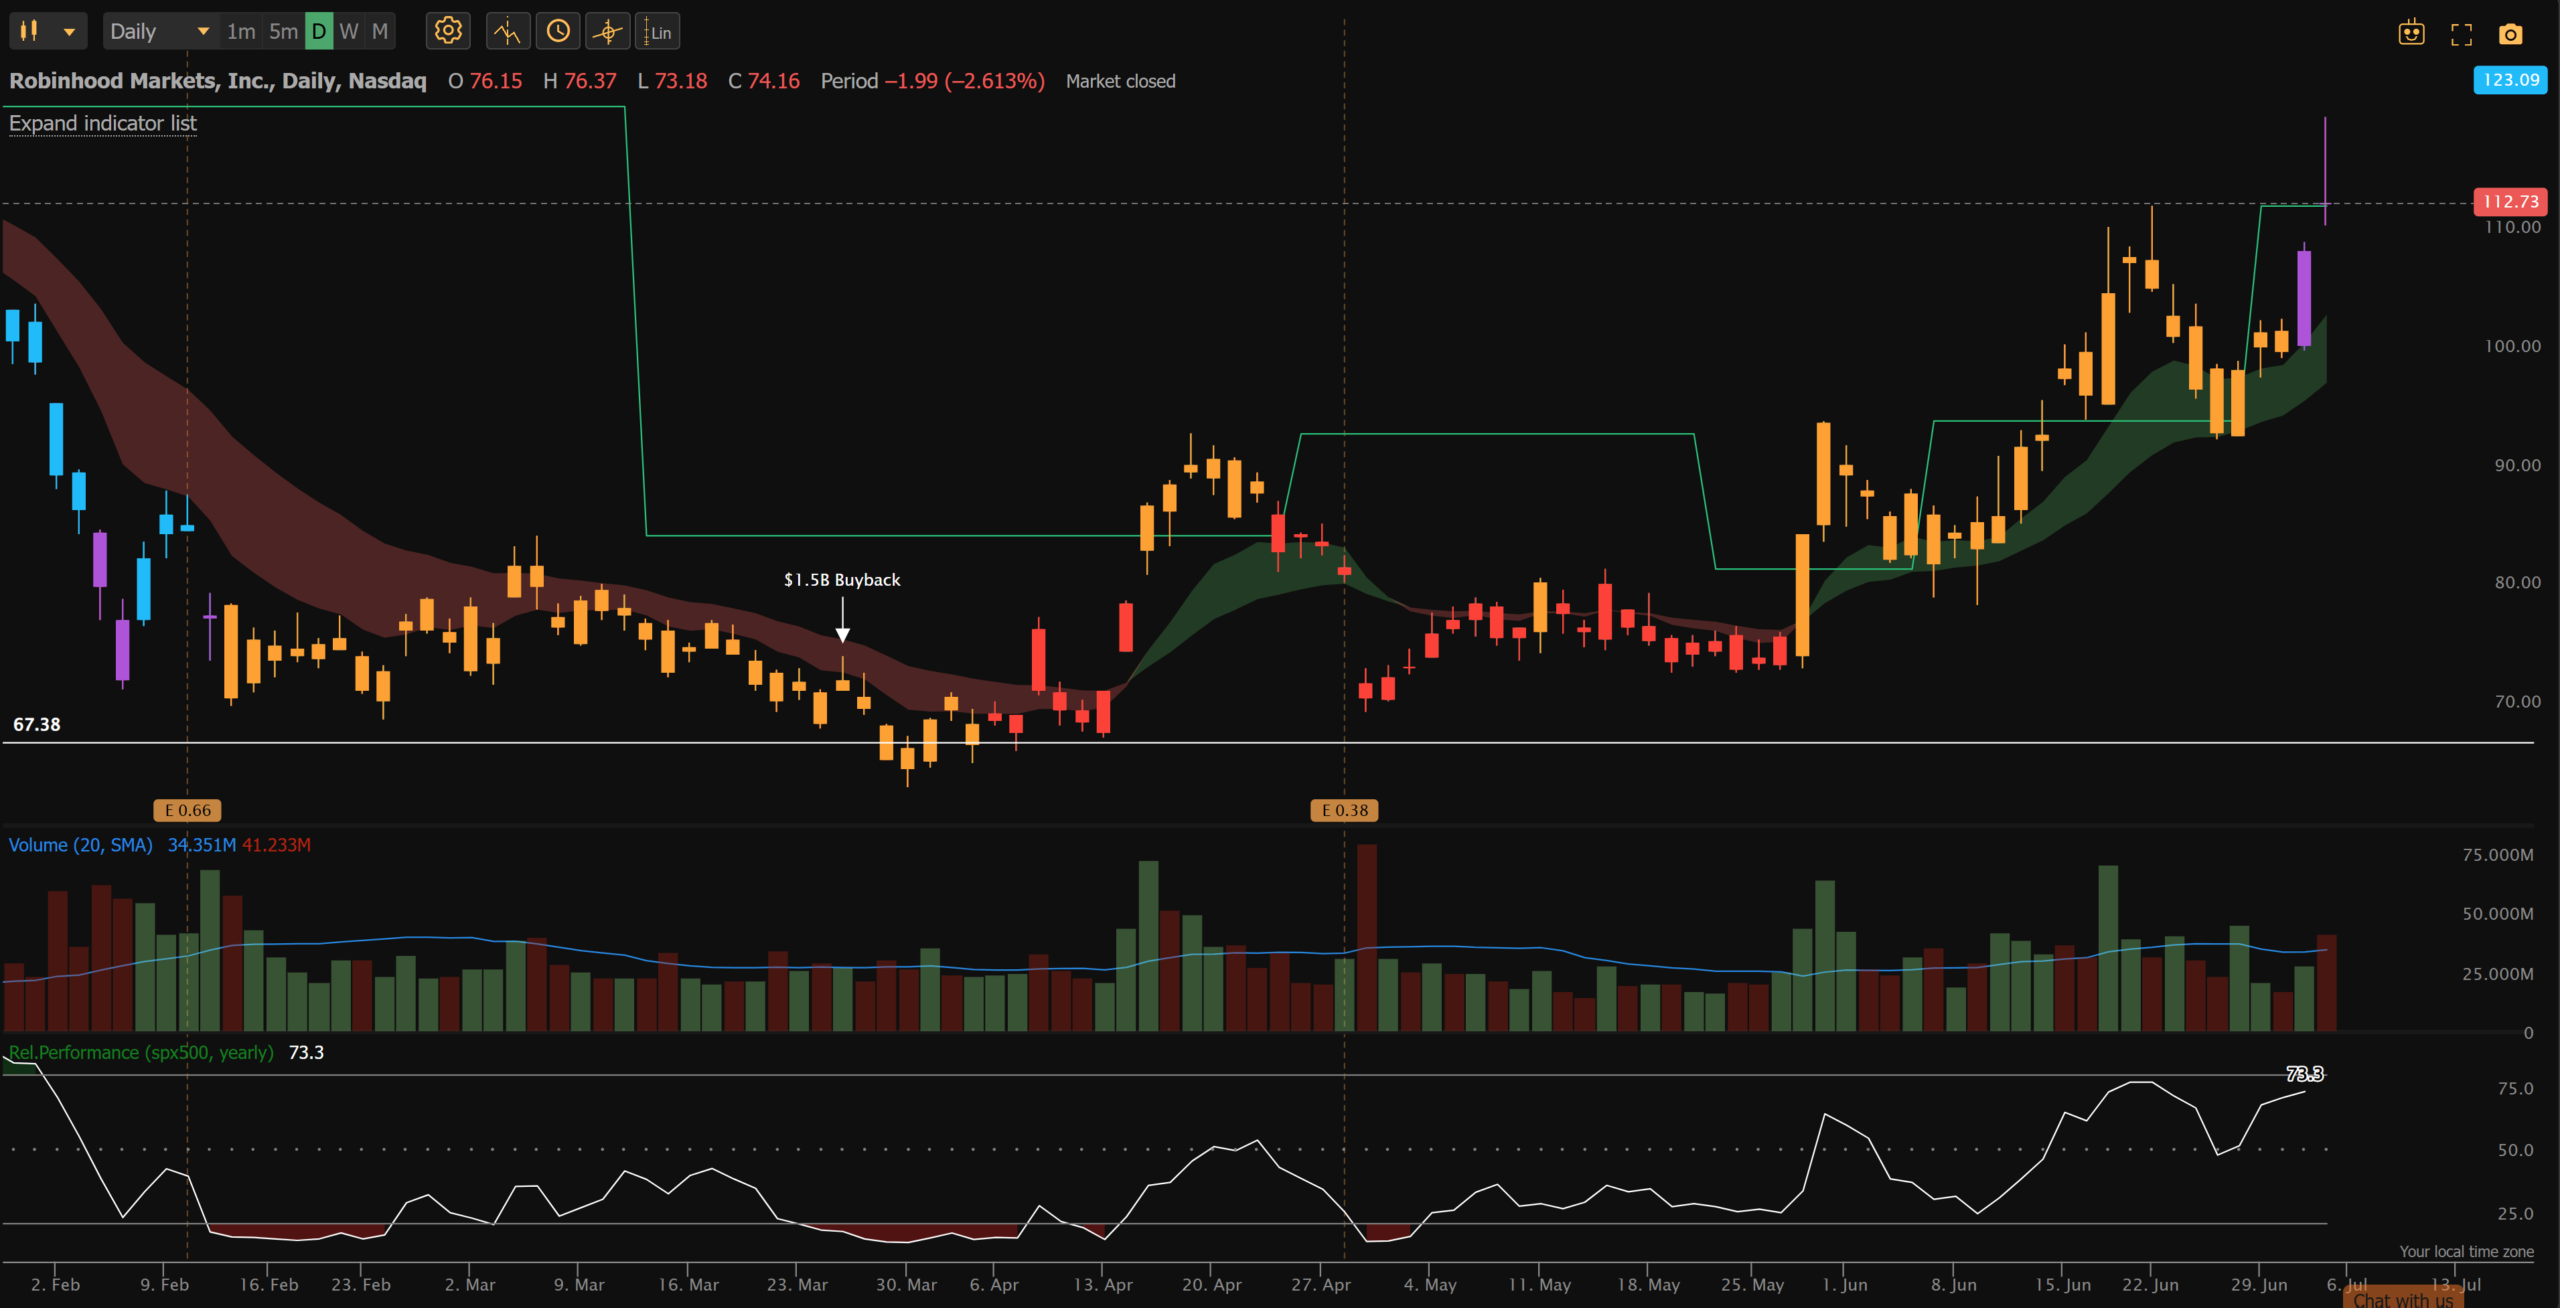
- Daily pivot breakout on 7/2/26 on a purple momentum candle, so one filter has flipped bullish while the other is still bearish, an early-stage setup rather than a confirmed one.
- Bull case: Explosive revenue growth with multiple quarters of +45% to +100%+ YoY, operating margins running 38% to 51%, and a TAM that keeps expanding across crypto, futures, prediction markets, banking, Gold subscriptions, and tokenization.
- Bear case: Highly cyclical and sentiment-driven since revenue is tied to trading and crypto volumes, Q1’26 revenue missed estimates by 6% with growth slowing to +15% from +69%, and 7/29 earnings carry gap risk.
Want the full breakdown?
This is the short version. Every Sunday my free newsletter goes deeper with my live swing watchlist, the full sector rotation map, and the exact daily pivot strategy rules I trade. Drop your email below and you will get the next one.
Resources
- Join the free Financial Tech Wiz Discord
- The daily pivot breakout scanner and indicator I use on TrendSpider
- The Financial Tech Wiz Trading Journal
- The free trading journal template
Get Your Free Trading Resources
Grab the free trading journal template plus the same tools we use to stay organized, consistent, and objective.
- Free trading journal template
- Custom indicators, watchlists, and scanners
- Access our free trading community
Enter your email below to get instant access.
No spam. Unsubscribe anytime.







