how to get candlesticks on tradingview
|

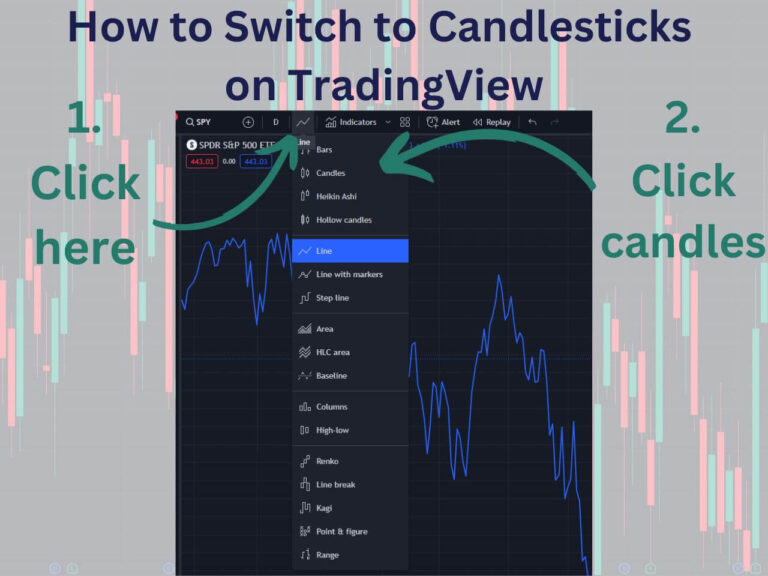
How to Get Candlesticks on TradingView: A Comprehensive Guide

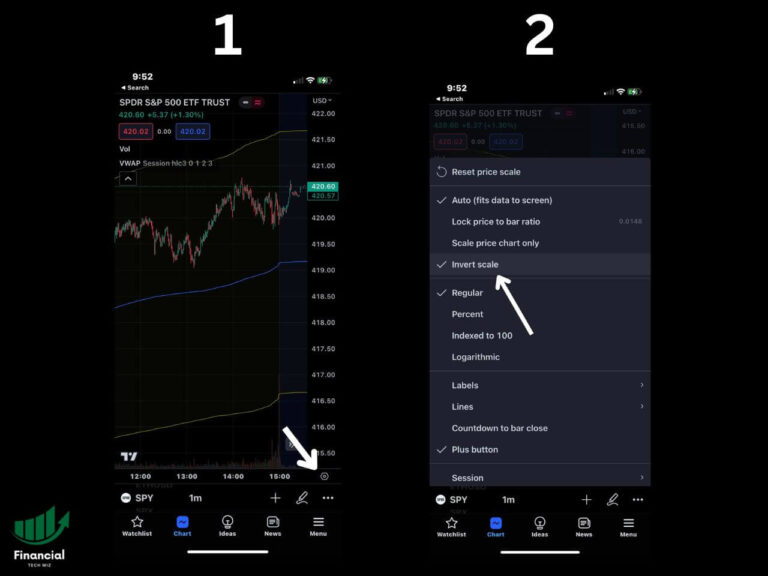
Candlestick patterns are powerful tools for traders and investors looking to analyze price movements and make informed trading decisions. However, there are times when you may find that candlesticks have disappeared from your TradingView chart. In this article, we’ll explore what candlestick patterns are, how to get them on TradingView, and how to unhide them…

bearish engulfing candle pattern chart

Bearish Engulfing Pattern: Spotting and Trading Tips

Understanding chart patterns forms the backbone of technical analysis for traders and investors. One such intriguing pattern is the bearish engulfing pattern, a key tool in predicting potential price reversals. This article will shed light on this pattern, comparing it to its bullish counterpart and exploring its practical implications in the trading world. What is…

revenge trading

Revenge Trading: Conquer Your Emotions, Secure Your Trades

Trading in the financial markets is as much about strategy as it is about psychology. One psychological trap that traders often fall into is revenge trading. What is Revenge Trading? Revenge trading occurs when a trader, driven by the need to recover from a significant loss, impulsively enters a new trade without proper analysis or…

tradingviewimpliedvolfeatured
|

How to View Implied Volatility and IV Rank/Percentile on TradingView

Implied volatility plays a crucial role in options trading, providing insights into the market’s expectations for future price movements. This article will explore how to view and interpret implied volatility on TradingView. Understanding Implied Volatility (IV) Implied volatility represents the market’s perception of the magnitude of potential price changes in an underlying asset. A stock’s…

best monitors for trading

The Best Trading Monitors

Are you a day trader or stock trader looking for the best trading monitors to enhance your trading experience? Having the right monitor setup can significantly improve your ability to analyze charts, spot trends, and make informed trading decisions. This article will explore some of the top trading monitors available in the market that can…

double doji

Double Doji Candle Pattern: A Key to Profitable Stock Trading

What is the Double Doji Candlestick Pattern? Understanding candlestick patterns is crucial for making informed trading decisions in stock trading. One such pattern is the Double Doji Candle, which represents a strong reversal signal. This article will dive into the characteristics of the Double Doji pattern, explore the different types of Doji candlesticks, and discuss…

Long-Legged Doji Candle

The Long-Legged Doji Candlestick Pattern Explained

Candlestick patterns provide valuable insights into market sentiment and potential trend reversals. One such pattern is the Long-Legged Doji. This article will explore the characteristics, interpretation, and trading strategies associated with this candlestick pattern. The charts used are from TradingView, an excellent choice for performing technical analysis. Long-Legged Doji Candle Meaning The Long-Legged Doji is…