Exploring JEPI and JEPQ ETFs
Exchange-traded funds (ETFs) offer investors a convenient way to diversify their portfolios and gain exposure to a range of assets. In this article, we’ll delve into the details of two popular ETFs: the JPMorgan Equity Premium Income ETF (JEPI) and the JPMorgan Nasdaq Equity Premium Income ETF (JEPQ).
Both ETFs employ similar strategies, but differences in benchmarks and performance make it essential for investors to understand their unique attributes.
How JEPI and JEPQ Differ
- Background Information:
- JEPI:
- Primary Benchmark: S&P 500 index
- Inception Date: May 2020
- Expense Ratio: 0.35%
- Yield: Close to 10%
- JEPQ:
- Primary Benchmark: Nasdaq-100 index
- Inception Date: May 2022
- Expense Ratio: 0.35%
- Yield: Varies
- Total Returns Since May 2022:
- JEPQ: -1.11%
- JEPI: 3.08%
Comparing ETFs With TradingView
When comparing ETFs, it is crucial that you are comparing the total return to include dividend payments. TradingView allows you to compare several stocks and ETFs at once on a single chart adjusted for dividends.
You can simply sign up for a free TradingView account and type the stock ticker you want to compare. Next, click the plus sign next to the ticker at the top left of the chart to add symbols to compare.
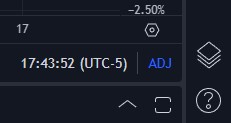
Finally, ensure you click the ‘ADJ’ at the bottom to adjust the returns for dividends!
As you can see in the TradingView chart below, you can compare multiple funds and ETFs on a single chart, making your research much easier. Feel free to compare any ETFs you’d like using the widget.
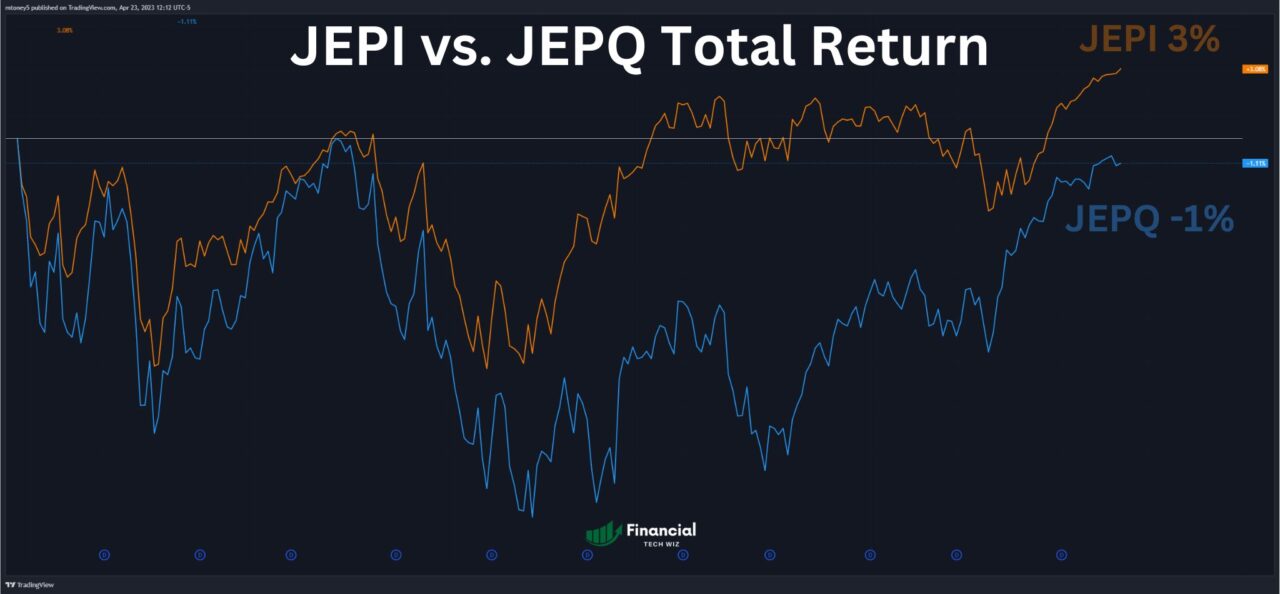
By using TradingView, we compared JEPI and JEPQ’s performance since JEPQ’s inception in May 2022. JEPQ has underperformed with a total return of -1.11%, while JEPI achieved a positive return of 3.08%.

Comparing Investment Strategies and Outlook
- Performance Analysis: JEPQ’s underperformance may be attributed to its heavier reliance on the tech sector, which faced volatility during the time frame.
- Active Stock Selection: JEPI avoids overvalued market sectors and maintains a value-oriented approach. JEPQ leans more heavily on its benchmark, with greater exposure to overvalued sectors.
- Future Outlook: Given the potential for the S&P 500 to outperform the Nasdaq-100 over the next five years, JEPI’s reliance on the S&P 500 may prove advantageous.
Key Considerations for Investors
Investors should consider several factors when evaluating JEPI and JEPQ:
- Personal investment goals and risk tolerance
- The importance of underlying benchmarks and indices
- Differences in the ETFs’ investment strategies
The Financial Tech Wiz ETF Comparison Tool
You can use the ETF comparison tool below to compare over 2,000 ETFs and mutual funds with data I manually collected:
Making Informed Investment Decisions
In summary, JEPI and JEPQ provide investors with unique opportunities to earn income through covered call strategies. While JEPI has shown stronger performance and offers a value-oriented approach, JEPQ offers exposure to the Nasdaq-100.
Investors are encouraged to conduct their own research and consider their investment objectives before making decisions. Additionally, consider checking out our article about QQQ vs. SPY.
Before you go
Our comprehensive analysis of QYLD vs. JEPI provides an in-depth examination of their respective strategies, performance, and key considerations for investors looking to diversify their income sources.
If you want to keep educating yourself about personal finance, you must check out these posts as well:
What is the Most Successful Options Strategy
Options Trading for Income: The Complete Guide
Mark Minervini's Trading Strategy: 8 Key Takeaways
The Best Options Trading Books
The Best Laptops and Computers for Trading
How to Get a TradingView Free Trial
The Best TradingView Indicators
This article contains affiliate links I may be compensated for if you click them.