Double Doji Candle Pattern: A Key to Profitable Stock Trading
What is the Double Doji Candlestick Pattern?
Understanding candlestick patterns is crucial for making informed trading decisions in stock trading. One such pattern is the Double Doji Candle, which represents a strong reversal signal.
This article will dive into the characteristics of the Double Doji pattern, explore the different types of Doji candlesticks, and discuss effective trading strategies to capitalize on this pattern.
The Double Doji Candle Pattern
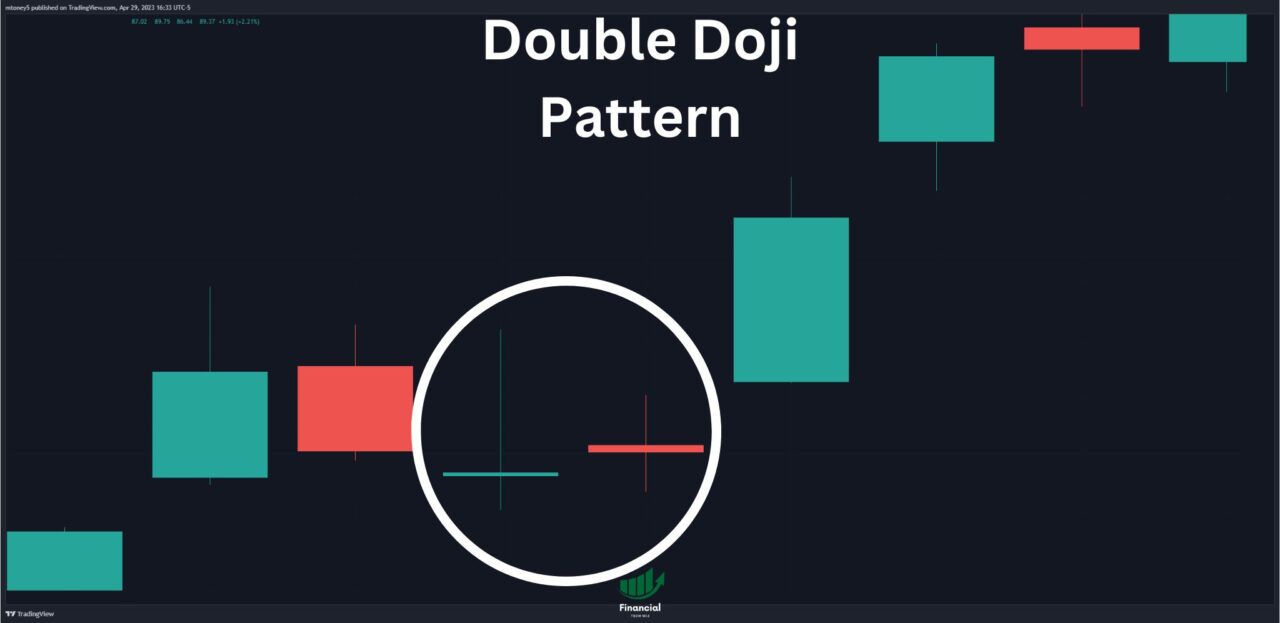
The Double Doji pattern is formed by two consecutive Doji candlesticks and indicates a significant reversal in the stock’s direction. This pattern is relatively rare but has a stronger reversal strength than a Single Doji. To fully grasp the implications of the Double Doji pattern, let’s first understand the various types of Doji candlesticks:
Doji
- The Doji candlestick represents a pause in the trend and reflects indecision in the market. It has a small body, with the opening and closing prices nearly identical. The length of the shadows can vary.
- Learn more about Doji candle types in our article: Doji Candle Types
Long-legged Doji
- The Long-legged Doji is associated with greater market volatility. It features long upper and lower shadows, indicating that the trading range was extensive during the period.
Dragonfly Doji
- The Dragonfly Doji is typically found at the bottom of a downtrend. It suggests buyers have rejected lower prices, signaling a potential bullish reversal.
- Discover more about the Dragonfly Doji in our article: Dragonfly Doji Candlestick
Gravestone Doji
- The Gravestone Doji is often observed at the top of an uptrend. It indicates sellers have rejected higher prices, suggesting a possible bearish reversal.
- Explore the Gravestone Doji further in our article: Gravestone Doji
The occurrence of two consecutive Doji candlesticks in the Double Doji pattern enhances the probability of a successful analysis. When two identical candlesticks appear back-to-back, the chances of predicting the market outcome increase significantly.
Double Doji Trading Strategy
The Double Doji Candle pattern not only provides valuable insights into potential reversals but can also be used as the basis for a trading strategy. By combining the Double Doji pattern with other technical analysis tools, traders can identify favorable entry and exit points to maximize their trading opportunities.
Here’s a simple trading strategy that incorporates the Double Doji pattern:
- Identify the Double Doji Pattern: Look for consecutive Doji candlesticks in a chart. The Double Doji pattern consists of two Doji candlesticks occurring one after the other.
- Confirm the Trend: Assess the prevailing trend in the market. The Double Doji pattern is most effective when it appears after a clear up or downtrend, indicated by a series of consecutive bullish or bearish candlesticks.
- Identify Support and Resistance Levels: Determine key support and resistance levels on the chart. These levels can act as triggers for the Double Doji pattern. When the Double Doji pattern coincides with a touch of an important support or resistance level, it enhances the pattern’s reliability.
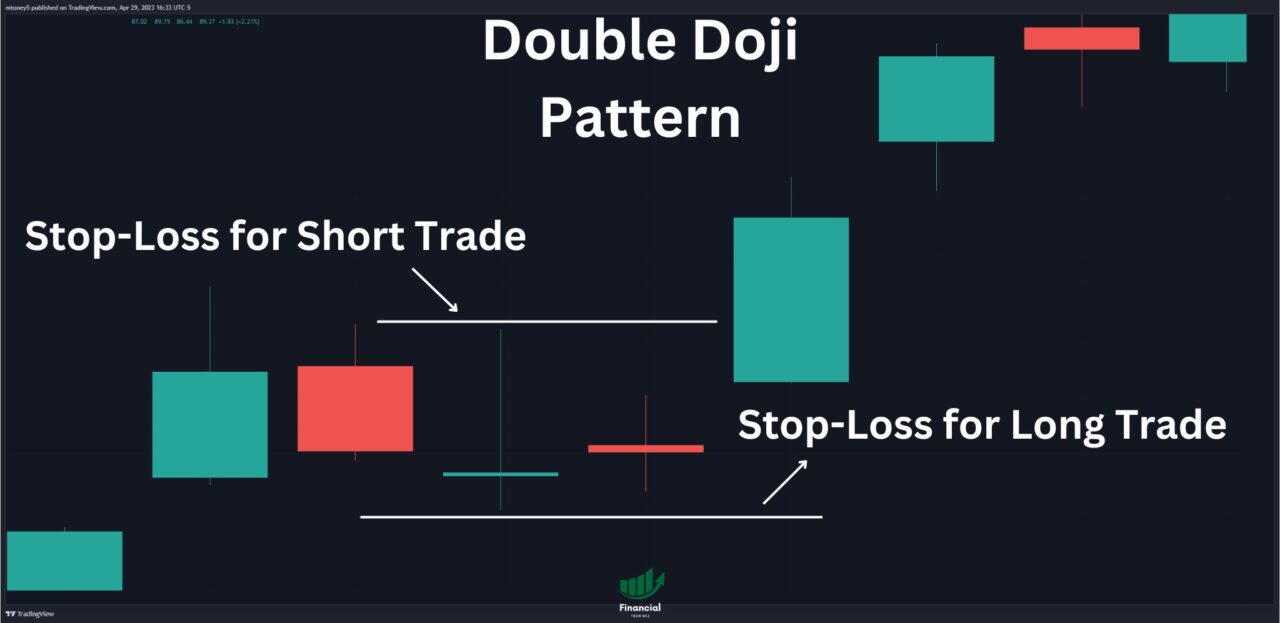
- Place Pending Orders: Once the Double Doji pattern is identified and the support or resistance level is touched, place two pending orders. One order should be set just above the high of the Double Doji pattern and the other just below its low. These orders will be triggered if the price breaks out in either direction.
- Set Stop Loss: Set a stop-loss order to manage risk. For a buy (long) trade, place the stop-loss order below the low of the Double Doji pattern. For a sell (short) trade, place the stop-loss order above the high of the pattern.
- Manage the Trade: There are multiple ways to manage the trade:
- Take Profit Method 1: Set the take-profit level equal to the stop-loss level. This approach ensures a 1:1 risk-to-reward ratio for the trade.
- Take Profit Method 2: Open two identical trades. In the first trade, set the take-profit level equal to the stop-loss level. In the second trade, set a higher take-profit level, typically twice the size of the stop-loss. Once the first trade hits its take-profit level, move the stop loss of the second trade to the breakeven point.
- Take Profit Method 3: Open one trade and close 80% of the position when the price reaches the first take-profit level, which is usually half the size of the stop-loss. Let the remaining 20% of the position run and set the take-profit level twice the size of the stop-loss.
Double Doji Candlestick Pattern | Bottom Line
The Double Doji Candle pattern is a powerful tool for identifying potential reversals in stock trading. By understanding the different types of Doji candlesticks and their significance, traders can enhance their analysis and decision-making.
Implementing effective trading strategies, such as identifying triggers and developing a trading plan, can further improve trading outcomes. Additionally, using charting tools like TradingView make spotting patterns much easier.

For more insights into candlestick patterns and their applications in stock trading, we recommend exploring our articles:
Remember, successful stock trading requires a combination of knowledge, strategy, and disciplined execution. Stay informed, adapt to market conditions, and continue learning to become a proficient trader.
This article contains affiliate links I may be compensated for if you click them.
Get Your Free Trading Resources
Grab the free trading journal template plus the same tools we use to stay organized, consistent, and objective.
- Free trading journal template
- Custom indicators, watchlists, and scanners
- Access our free trading community
Enter your email below to get instant access.
No spam. Unsubscribe anytime.


