Hanging Man Candle: Recognizing Bearish Reversals
Candlestick patterns play a crucial role in technical analysis, offering valuable insights to traders and investors. Among these patterns, the Hanging Man candlestick pattern stands out as a noteworthy signal, often indicating a potential bearish reversal.
This guide will explore the nuances of the Hanging Man pattern, compare it with similar patterns, and provide practical trading tips.
Understanding the Hanging Man Candlestick Pattern
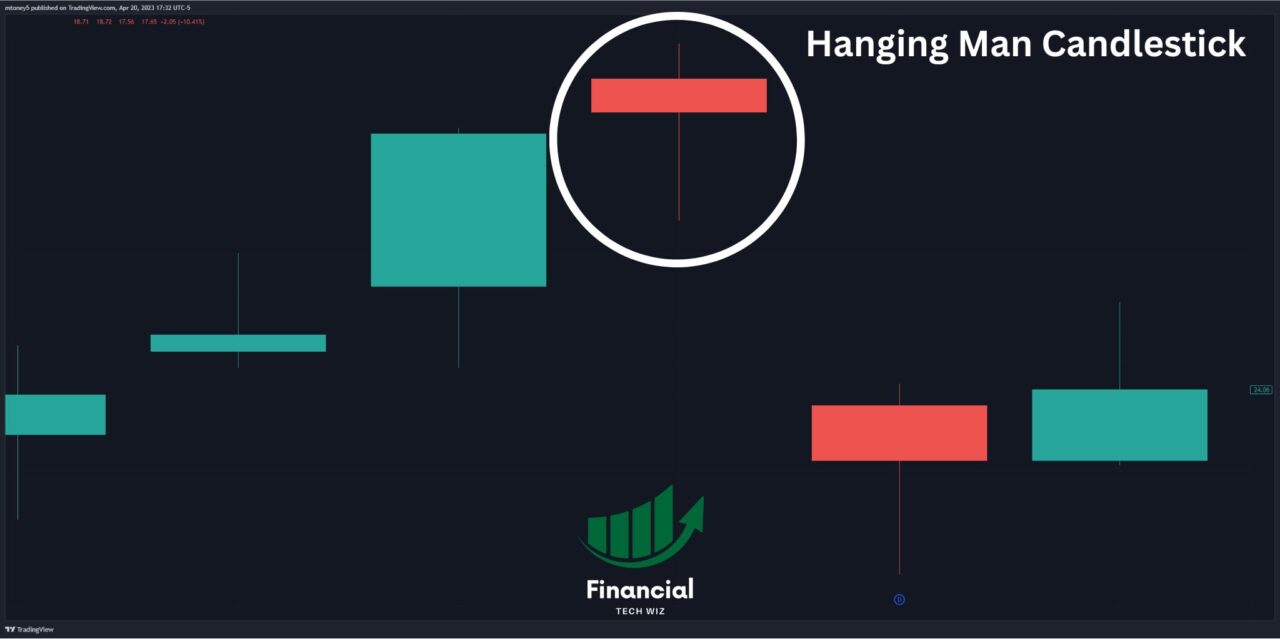
The Hanging Man pattern is a single-candle bearish reversal pattern characterized by the following features:
- A small body located at the top of the candle
- A long lower shadow that is at least twice the length of the body
- Little or no upper shadow
The real body’s color is unimportant—it can be either green or red. The pattern typically appears after an uptrend or price rise.
A Tale of Two Patterns: Hanging Man vs. Hammer
Though the Hanging Man pattern resembles the Hammer pattern, the two serve different purposes in trading:
- Hanging Man: A bearish reversal pattern that occurs after an uptrend. It signals that bears gained control during the trading session, but bulls pushed the price back up, resulting in a long lower shadow.
- Hammer: A bullish reversal pattern that occurs after a downtrend. It signals that bulls have regained control and driven the price higher after initial selling pressure. Similar to the Hammer, the Inverted Hammer pattern is a bullish reversal signal that appears after a downtrend.
In summary, the Hanging Man is bearish, while the hammer and inverted hammer are bullish. The hanging man follows an uptrend, while the hammers follow a downtrend.
Gravestone Doji: A Relative of the Hanging Man
Similar to the Hanging Man, the Gravestone Doji is a bearish reversal pattern with a long upper shadow and no real body. The difference lies in the placement of the shadows:
- Hanging Man: A long lower shadow and a small body at the top
- Gravestone Doji: A long upper shadow and no real body (opening and closing prices are the same)
Both patterns signal potential trend reversals, but the Gravestone Doji is formed after an uptrend and implies that bears have taken control by pushing the price down from its high.
Making Sense of the Hanging Man: Interpretation and Confirmation
A Hanging Man pattern on its own is not a definitive signal; traders should seek confirmation before taking action:
- Look for the Hanging Man to form after an upward price trend.
- Wait for a confirmation candle on the following day that exhibits a price drop (e.g., a lower close than the Hanging Man’s close).
- Consider shorting near the close of the red day following the Hanging Man.
Thomas Bulkowski’s research suggests that Hanging Man patterns with heavy trading volume and longer lower shadows are better predictors of price moving lower.
Practical Tips for Trading the Hanging Man
Trading the Hanging Man pattern requires caution and consideration:
- Hanging Man patterns within a third of the yearly high tend to act as continuations of the primary price trend.
- Place a stop-loss order above the high of the Hanging Man candle to manage risk.
- Use additional technical indicators and tools like TradingView to enhance your analysis.
The Final Word: Treading Carefully with the Hanging Man
The Hanging Man pattern can be a valuable addition to a trader’s toolkit, but its interpretation requires careful analysis and confirmation. Though traditionally seen as a bearish reversal, it can occasionally signal a bullish continuation.
As always, using multiple indicators, staying informed, and making informed trading decisions based on market conditions are essential. Experience and expertise play a crucial role in recognizing genuine Hanging Man patterns and distinguishing them from false signals.
Further Considerations: Limitations and Variable Performance
As with any technical analysis tool, the Hanging Man pattern is not infallible. Empirical research suggests that the Hanging Man pattern may act as a bullish continuation pattern approximately 59% of the time, which is close to random. This variability underscores the importance of considering multiple factors before making trading decisions.
Several factors may contribute to the variable performance of the pattern:
- The overall market environment: The broader market context can influence the effectiveness of the pattern. For example, a Hanging Man pattern formed during a strong bullish market may not lead to a significant reversal.
- The presence of nearby support and resistance levels: Nearby support levels may halt a potential bearish reversal signaled by the Hanging Man pattern.
- News and events: Fundamental factors, such as earnings reports, economic data, and geopolitical events, can override technical signals and affect price movement.
In Conclusion: Harnessing the Subtleties of the Hanging Man
The Hanging Man pattern provides traders with a signal to watch for potential bearish reversals in an uptrend. While the pattern can be a valuable tool, traders must exercise caution, seek confirmation, and consider the broader market context.
By combining the Hanging Man pattern with other technical and fundamental analysis techniques, traders can enhance their decision-making process and confidently navigate the financial markets.
For those seeking to further their knowledge of technical analysis and chart patterns, TradingView offers a comprehensive suite of charting tools, indicators, and resources. With a discount and a 30-day free trial, traders can explore various features and improve their trading strategies.

Whether you’re a seasoned trader or a beginner, understanding the intricacies of candlestick patterns like the Hanging Man is an essential step on the path to successful trading. Keep learning, stay informed, and harness the power of technical analysis to navigate the ever-changing financial markets.
This article contains affiliate links I may be compensated for if you click them.
Get Your Free Trading Resources
Grab the free trading journal template plus the same tools we use to stay organized, consistent, and objective.
- Free trading journal template
- Custom indicators, watchlists, and scanners
- Access our free trading community
Enter your email below to get instant access.
No spam. Unsubscribe anytime.


