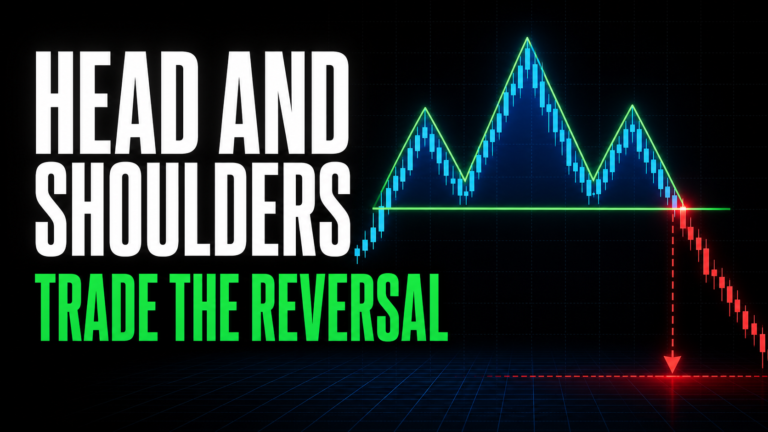
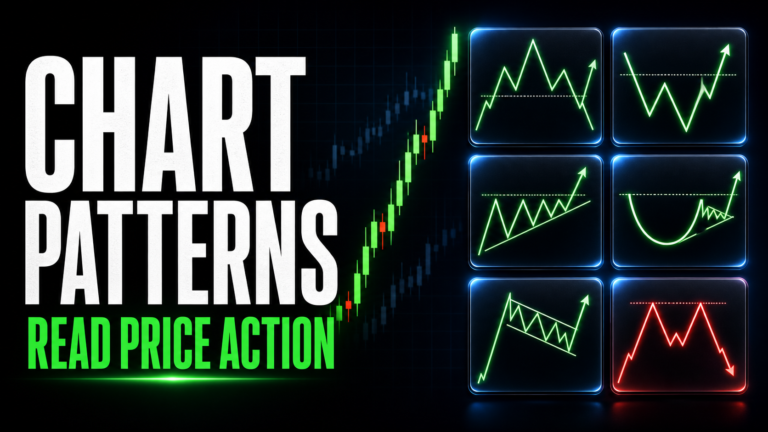
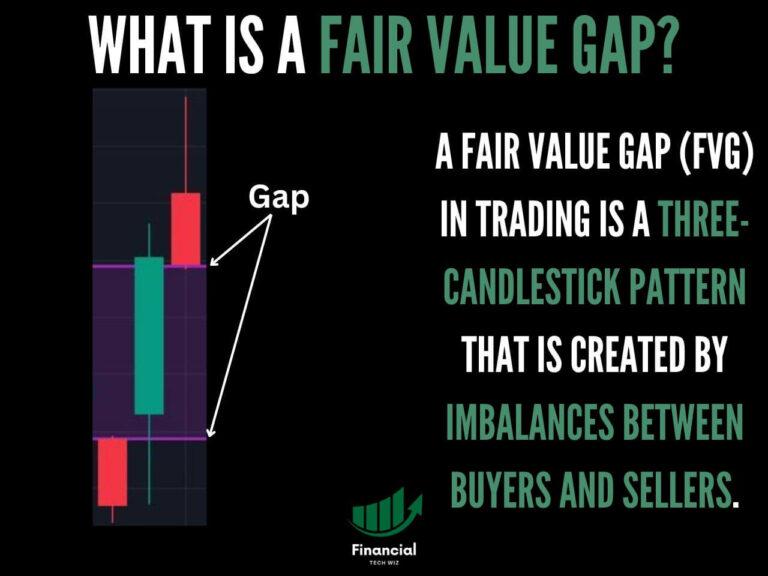
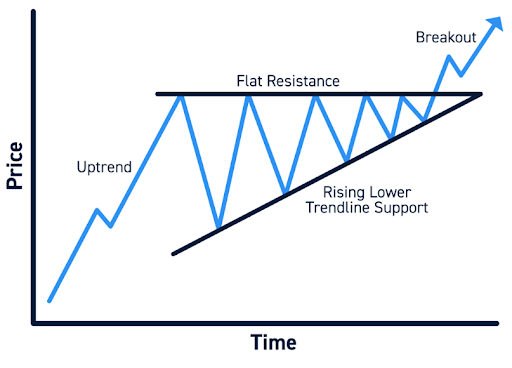
trianglechartpattern

The Triangle Chart Pattern Explained

Even the most enthusiastic value investors know technical analysis is critical to well-informed investing. Major news outlets often tout momentum investing as outperforming value-based strategies over the past decade. Likewise, financial service firms showcase the impact of these technical trading strategies and factors. This article focuses on a specific technical analysis, the Triangle Chart Pattern. We’ll…

best technical analysis books

The 7 Best Technical Analysis Books to Improve Your Trading

Technical analysis is the study of price movements and patterns in financial markets, using charts and indicators to identify trends, signals, and opportunities. In this article, we will review the 7 best technical analysis books that every trader should read. Whether you are a beginner or a seasoned trader, these books will help you improve…

emavssmavswma

MA vs. EMA vs. SMA vs. WMA – Moving Average Indicators

Moving averages are fundamental tools used by traders and analysts in financial markets to understand and predict price trends. This article explains the primary types of moving averages: Simple Moving Averages (SMA), Exponential Moving Averages (EMA), and Weighted Moving Averages (WMA), highlighting their differences and practical applications. EMA vs. SMA vs. WMA at a Glance…

best indicators for day trading volume profile
|

The Best Indicators for Options Trading

Learn how technical analysis can benefit your options trading. Magic options trading chart indicators do NOT exist Technical analysis for options trading is a somewhat controversial topic, as many hedge funds have proved that it is tough to time the market accurately. There are no magic indicators out there that will be able to give…

tradingview keltner channel

What is the Keltner Channel on TradingView? A Complete Guide

Are you looking for a reliable indicator that can help you identify price trends, volatility levels, and potential trading opportunities? If so, you might want to check out the Keltner Channel on TradingView. The Keltner Channel is a banded indicator that shows you the range of price movement around a moving average. It can help…

tradingviewrectangle
|

How to Draw a Rectangle on TradingView: A Step-by-Step Guide

TradingView is one of the most popular platforms for traders and investors who want to analyze and trade the financial markets. It offers a variety of tools and features that make it easy to create and customize charts, indicators, strategies, and more. One of the tools that you can use on TradingView charts is the…