How to Draw a Rectangle on TradingView (2026 Guide)
Traders draw rectangles on TradingView for two reasons: to visually mark a level or zone they care about (support, resistance, a prior range), and to identify the rectangle chart pattern, a sideways consolidation that often precedes a breakout. The drawing tool itself takes about ten seconds to learn. Using it well is what separates a clean chart from a cluttered one.
This guide walks through the five clicks needed to place a rectangle on a TradingView chart, then covers how to actually trade the rectangle chart pattern when one shows up.
Key Takeaways
- The rectangle tool lives in the Shapes group on the left-side drawing toolbar. Click once at one corner of the area, click again at the opposite corner.
- Right-click the border (or double-click) to open Settings and customize fill color, opacity, border style, and the price/time anchor.
- The rectangle chart pattern is sideways price action between parallel support and resistance. Trade the breakout in the direction of the pre-pattern trend, with volume confirmation and a measured-move target equal to the rectangle height.
Recommended Tool
Financial Tech Wiz Trading Journal
Tag every rectangle, triangle, and breakout setup, then see win rate by pattern, hold duration, and symbol. Equity curve plus AI-generated insights on what is actually working in your account. Starts at $9.91/month billed annually.
Try It Free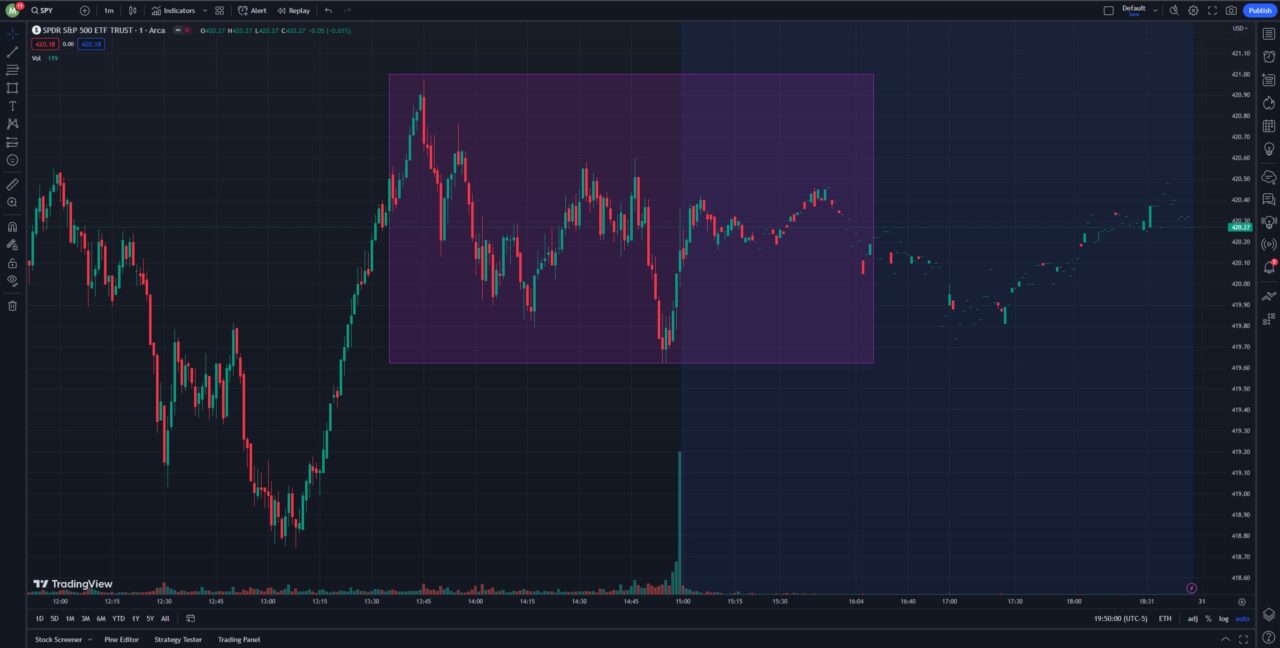
Step 1: Open a chart on TradingView
Pull up the symbol you want to analyze. The search box at the top left of the chart workspace finds any ticker, index, or futures contract.
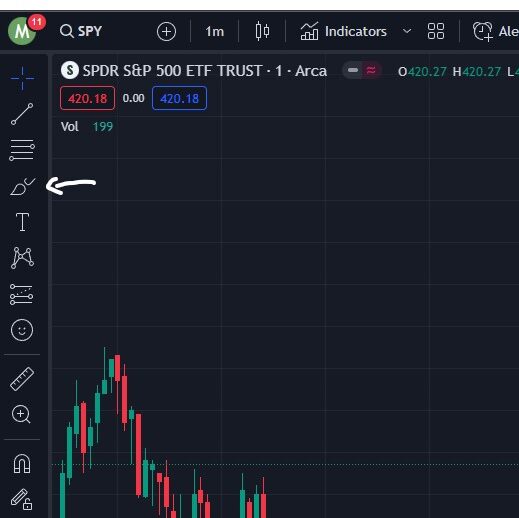
Step 2: Open the drawing toolbar
The drawing toolbar runs vertically along the left edge of the chart. The Shapes group (third icon from the top in most layouts) is where the rectangle lives. Click the small arrow next to the icon to expand the full list and select Rectangle.
Step 3: Place the rectangle on the chart
Click the chart at one corner of the area you want to mark. Move the cursor to the opposite corner and click again. The box draws between the two clicks. Hold Shift while drawing to constrain the shape to a perfect square.
Drag the corner dots to resize, drag the center dot to reposition, and the rectangle stays anchored to the price and time you placed it on as you scroll the chart.
Step 4: Customize the rectangle
Right-click the border and choose Settings, or double-click the border. The dialog has four tabs worth knowing:
- Style: border color, border thickness, fill color, and fill opacity. A 10 to 20 percent opacity fill keeps the box visible without obscuring candles.
- Text: add a label inside the rectangle. Useful for noting the level (e.g. “Q1 high”) or the trade plan (“entry above 425”).
- Coordinates: type exact price and time values for each corner. Lock the coordinates so the rectangle does not move if you brush against it.
- Visibility: show or hide the rectangle on specific timeframes. Useful when a level matters on the daily but clutters a 5-minute chart.
Step 5: Edit or delete the rectangle
To delete, click the rectangle border and press Delete on your keyboard, or right-click and choose Remove drawing. To re-edit, double-click the border to reopen Settings. Save a rectangle as a template (right-click, Template, Save As) if you use the same fill color and opacity across charts.
Charting Platform
Don’t have TradingView yet?
The rectangle tool, advanced drawings, multi-chart layouts, and the full indicator library all live on TradingView. Start a free trial and grab a discount on a paid plan with my link.
Get Your TradingView Free TrialTrading the Rectangle Chart Pattern
The rectangle is also a chart pattern. It forms when price stalls between a flat support level and a flat resistance level, with at least two touches of each. The two horizontal lines mark a balance: buyers absorb supply at the bottom of the range, sellers cap rallies at the top, and the market chops sideways until one side gives.
Whether the breakout is bullish or bearish depends on what came before the rectangle. A rectangle that prints inside an uptrend is usually a continuation pattern, and price tends to break out the top. A rectangle inside a downtrend tends to break out the bottom. Compared with an ascending triangle, where the lower trendline slopes up and signals building demand, the rectangle’s flat top tells you buyers and sellers are evenly matched until volume tips the balance.
The trade plan has four parts:
- Entry: a candle close beyond the rectangle, in the direction of the pre-pattern trend. Wait for the close, not the wick. Confirm with volume that is at least 1.5x the average volume of the consolidation candles.
- Stop: the opposite side of the rectangle. If you bought a breakout above resistance, your stop sits below support. This keeps the trade invalidated by the same level that defined the setup.
- Target: measured move. Take the height of the rectangle (resistance minus support) and project that distance from the breakout point in the breakout direction. A $5-tall rectangle that breaks at $100 targets $105.
- False breakouts: if price closes back inside the rectangle within one to three candles, the breakout failed. Exit at the next open. Continuation setups like the cup and handle pattern share the same measured-move logic and the same false-breakout risk.
Long, well-defined rectangles (multiple touches of each line, weeks of consolidation) tend to break harder than tight, short ones. The longer the coil, the bigger the move when it lets go.
Worked example
Imagine SPY trending up from $400 to $420 over three weeks, then chopping between $418 and $422 for the next ten trading days, with three touches of the $422 ceiling and three touches of the $418 floor. That is a textbook bullish-continuation rectangle. The trade plan writes itself: entry on a daily close above $422 with volume above the 20-day average, stop just below $418, and a measured-move target of $426 ($422 breakout point plus the $4 rectangle height).
Risk on that trade is roughly $4 per share ($422 entry minus $418 stop, ignoring slippage). Reward is also roughly $4 per share. That is a 1:1 reward to risk, which is exactly why the volume-confirmation filter matters: trade only the breakouts that actually have participation behind them, otherwise the win rate has to carry the whole trade plan and rectangles do not produce a high enough win rate to justify a 1:1 R without filtering.
Get Your Free Trading Resources
Grab the free trading journal template plus the same tools we use to stay organized, consistent, and objective.
- Free trading journal template
- Custom indicators, watchlists, and scanners
- Access our free trading community
Enter your email below to get instant access.
No spam. Unsubscribe anytime.
Common Mistakes When Using the Rectangle Tool
Most rectangle errors come from one of four habits:
- Drawing on the wrong timeframe. A consolidation that looks clean on a 5-minute chart often disappears on the daily, and vice versa. Pick a timeframe that matches your hold period and stay there.
- Treating every range as a tradable rectangle. A real chart-pattern rectangle has at least two clear touches of support and two of resistance, and it forms after a directional move. Random sideways noise inside no trend is not a setup. Pair the drawing with one of the volume tools listed in best TradingView indicators to confirm the breakout has real participation behind it.
- Ignoring volume on the breakout. A breakout candle on flat or declining volume is the textbook false-breakout setup. Wait for the volume confirmation before entering.
- Oversizing the position. Stop distance equals the rectangle height. A tall rectangle (large stop) means a smaller position size, not a bigger one. Size the trade off the stop distance, not the conviction.
Wrap-up
The rectangle tool is one of the simplest drawings on TradingView and one of the most useful, both for clean annotation and for trading the consolidation-and-breakout setup. Once you start trading rectangle setups live, log every entry, stop, and exit in the Financial Tech Wiz Trading Journal so you can measure win rate by setup type and see whether your rectangles are actually paying. New TradingView users can sign up for a free trial plus a discount with my link.
Frequently Asked Questions
How do I draw a rectangle on TradingView?
Click the drawing toolbar on the left of the chart, select the Rectangle tool from the Shapes group, then click the chart at the start of the area you want to highlight and click again at the opposite corner to close the box.
Can I draw a perfect square instead of a rectangle?
Hold the Shift key while you draw and TradingView constrains the shape to a square. Release Shift and the tool returns to free rectangle mode.
How do I change the color or border of a TradingView rectangle?
Right-click the rectangle border and choose Settings, or double-click the border. The Style tab controls fill color, opacity, border color, and border width. The Coordinates tab pins the box to specific price and time values.
What is the rectangle chart pattern and how do I trade it?
A rectangle pattern is sideways price action between two horizontal levels acting as support and resistance. Traders enter on a confirmed close beyond the range with volume backing the move, set the stop on the opposite side of the rectangle, and target a price move equal to the height of the rectangle measured from the breakout point.
Why is my rectangle moving when I scroll the chart?
The rectangle is anchored to chart coordinates by default. If you want it pinned to the visible window instead of price and time, switch the anchor mode in the rectangle Settings under Coordinates from Bar/Price to Pixel.
Get Your Free Trading Resources
Grab the free trading journal template plus the same tools we use to stay organized, consistent, and objective.
- Free trading journal template
- Custom indicators, watchlists, and scanners
- Access our free trading community
Enter your email below to get instant access.
No spam. Unsubscribe anytime.


