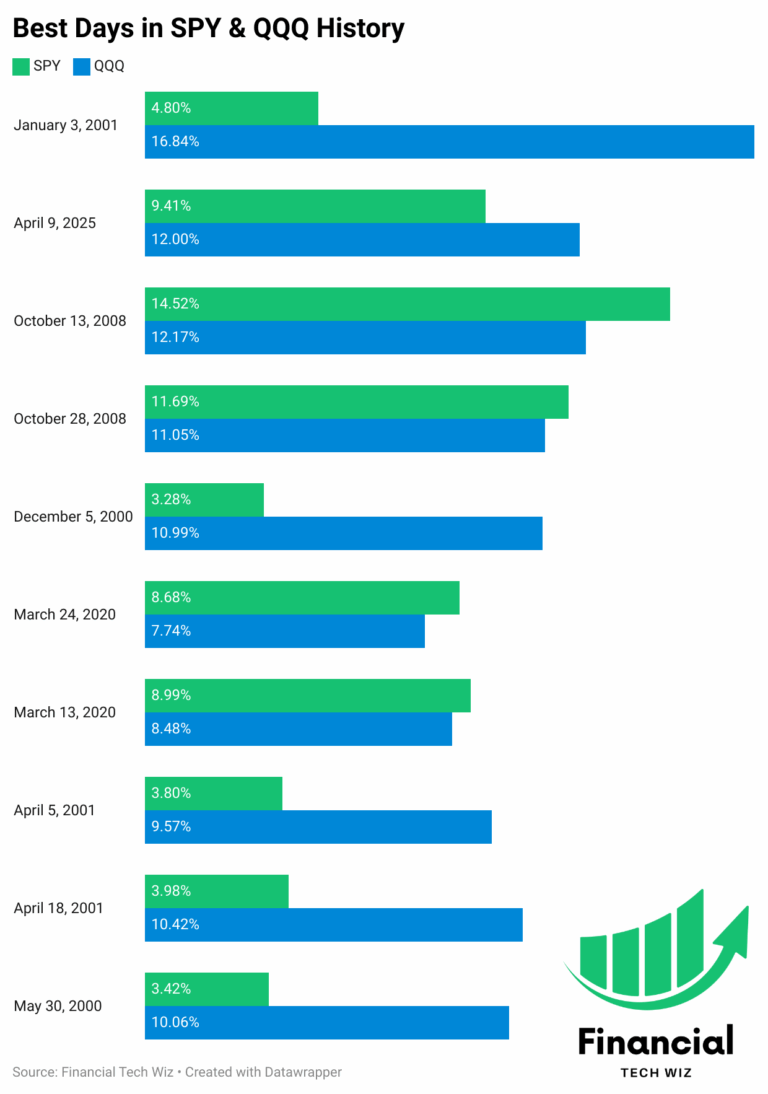
The 7 Best Laptops for Trading in 2024

bestlaptopsfortrading

If you need a trading computer or laptop, check these out.

I have created a list of laptops ranging from a few hundred dollars to over one thousand dollars. Instead of including a bunch of useless facts, I have stated the specs and the price.

If you are looking for charting software, we highly recommend TradingView, as it can be used on any computer.

Disclosure: This post contains affiliate links from Amazon and TradingView. As an Amazon Associate, I earn from qualifying purchases. This means that if you click on these links and make a purchase, I will receive a small commission at no extra cost to you.

The Best Laptops for Trading in 2024:

1- HP 14 Laptop

Specs:

– 14in screen

– 256 GB PCIe NVMe M.2 SSD

AMD Ryzen 5 5500U CPU

– 8 GB Ram

– Integrated graphics

2- Acer Nitro 5 AN515-55-53E5 Gaming Laptop

Specs:

– 15.6in screen

– 256 GB NVMe SSD

– Intel Core i5-10300H CPU

– Nvidia GeForce RTX 3050 GPU

3- ASUS TUF Gaming F15 Gaming Laptop

Specs:

– 15.6in screen

– 512 GB PCIe SSD

– Intel Core i5-10300H CPU

– Nvidia GeForce GTX 1650 4GB GDDR6

4- 2023 MacBook Pro Laptop

Specs:

– 16.2in screen

– 512 GB SSD

– Apple M3 Pro Chip w/ 12-Core CPU

– 18-Core GPU

5- Microsoft Surface Pro 8-13″

Specs:

– 13in screen

– 256 GB SSD

– Intel Iris Xe Graphics

– Intel Core i7 4.7GHz CPU

6- Acer Predator Helios 300 PH315-54-760S Gaming Laptop

Specs:

– 15.6in screen

– 512 GB SSD

– Intel i7-11800H CPU

– NVIDIA GeForce RTX 3060 Laptop GPU

7- Gaming Laptop by HP Victus

Specs:

– 15.6in screen

– 1TB SSD

– Intel 12th Core i5-12450H

– NVIDIA GeForce GTX 1650

The Best Computers for Trading

1- Lenovo IdeaCentre Gaming 5i

Specs:

– NVIDIA GeForce RTX 3060

– Intel i5 12400-16GB RAM

– 1TB HDD + 512GB SSD

– Win 11

– Mouse & Keyboard

2- Corsair Vengeance i7400 Series Gaming PC

Specs:

– Intel® Core™ i5 12600KF CPU

– NVIDIA® GeForce RTX™ 4060 GPU

– 16GB Vengeance RGB DDR4 Memory

– 1TB M.2 SSD

Benefits of Trading Laptops

Laptops that can run trading software smoothly are crucial if you are actively trading in the stock market.

Luckily, trading software like TradingView is not nearly as hard to run as a video game. Therefore, you can get a trading laptop for as little as a few hundred bucks. The following are all benefits of a good stock trading laptop:

– Lower risk of ruining a trade.

– No lag, so you can get in and out of trades smoothly.

– Clear screen to use for charting

If you care about the appearance of your notebook and are a creative person, you can decorate your notebook with custom stickers.

The Best Laptops for Trading: Bottom Line

If you are looking to start your trading journey, you must pick one of the best laptops for trading to ensure you can trade smoothly. If your stock trading laptop is not powerful enough to run trading software, you can potentially lose a lot of money.

Imagine if you place a trade and your computer crashes. If you did not place a stop loss, there is a chance that you lose a lot of money just because of your choice of laptop for trading.

Most charting software like TradingView is not hard to run. Therefore you do not have to spend an arm and a leg on a trading laptop. However, you must make sure the computer has a decent processor and RAM so that you can run trading platforms as smoothly as possible.

Before you go

If you want to keep educating yourself about personal finance, you must check out these posts as well:

What is the Most Successful Options Strategy

Options Trading for Income: The Complete Guide

Mark Minervini’s Trading Strategy: 8 Key Takeaways

The Best Options Trading Books

TradingView Pricing Guide

The Best Monitors for Trading

How to Get a TradingView Free Trial

The Best TradingView Indicators

The Best Keyboards For Trading

Russell 1000 vs. 2000 vs. 3000 Compared

russell1000vs2000vs3000info

Here are the key takeaways for the Russell 1000 vs. 2000 vs. 3000:

  • The Russell 1000 includes large-cap companies with higher market capitalizations.
  • The Russell 2000 focuses on smaller companies with lower market capitalizations.
  • The Russell 3000 combines both, offering a comprehensive view of the market’s large-cap, mid-cap, and small-cap segments.

russell1000vs2000vs3000info

Key Differences Between Russell 1000, 2000, and 3000

  • Market Capitalization Differences: The primary difference lies in the market capitalization of the companies each index represents.
  • Sector and Industry Representation: While the Russell 1000 is skewed towards more stable, large-cap sectors, the Russell 2000 offers exposure to various small-cap sectors. The Russell 3000, in contrast, offers a blend of both.
  • Performance Comparison: Historically, the Russell 1000 and 2000 are more stable, and the Russell 2000 is more volatile since it holds small-cap companies.

Visualizing the Returns of the Russell 1000, 2000, and 3000

In the TradingView chart below, all 3 of these indices are represented within the same chart, thanks to TradingView. TradingView allows you to compare multiple stocks, ETFs, cryptos, and more on a single chart.

As you can see, the Russell 1000 and 3000 are nearly identical, while the Russell 2000 is much more volatile. Note that this data is the total return and includes dividends when you click the “ADJ” button at the bottom right of the chart..

TradingView is a great way to compare assets on a single chart for free. Also, if you sign up for TradingView using our affiliate link, you can get a free trial and a discount on the premium subscriptions.

TradingView Limited Time Offer!

Exclusive Deal: 30-Day FREE Premium Access + Bonus Credit

Don’t Miss Out – Sign up for TradingView Now!

  • Advanced Charts
  • Real-Time Data
  • Track all Markets
CLAIM YOUR FREE TRIAL

Russell 1000 vs. 2000 vs. 3000 ETF Symbols

  • Russell 1000: IWB
  • Russell 2000: IWM
  • Russell 3000: IWV

What is the Russell 1000 Index?

  • Definition and Composition: The Russell 1000 Index represents the top 1000 U.S. companies based on market capitalization. It is a subset of the Russell 3000 Index and accounts for about 90% of the market capitalization of the U.S. stock market.
  • Types of Companies Included: This index predominantly includes large-cap companies, showcasing the highest-valued corporations in the United States.
  • Performance Characteristics: The Russell 1000 is known for its stability and includes well-established companies. It’s often used as a benchmark for large-cap investments.

What is the Russell 2000 Index?

  • Definition and Composition: The Russell 2000 Index tracks the performance of 2000 smaller companies in the U.S. stock market, making it a small-cap index.
  • Focus on Small-Cap Companies: This index provides a comprehensive view of the small-cap market, offering insights into lesser-known but potentially fast-growing companies.
  • Performance Trends: The Russell 2000 is known for its volatility and potential for high growth, making it an attractive option for risk-tolerant investors.

What is the Russell 3000 Index?

  • Definition and Composition: The Russell 3000 Index is a market-capitalization-weighted stock market index that includes the largest 3000 U.S. stocks, covering about 98% of the U.S. equity market.
  • Overall Market Representation: It combines the characteristics of both the Russell 1000 and 2000, offering a comprehensive view of the broader U.S. stock market.

Investment Strategies Based on Russell Indices

Each index serves different investment needs:

  • Russell 1000: Suitable for investors seeking stability and lower risk.
  • Russell 2000: Attracts those looking for growth potential in small-cap stocks.
  • Russell 3000: Ideal for investors seeking a total stock market index.

Comparing ETFs With TradingView

When comparing ETFs, it is crucial that you are comparing the total return to include dividend payments. TradingView allows you to compare several stocks and ETFs at once on a single chart adjusted for dividends.

You can simply sign up for a free TradingView account and type the stock ticker you want to compare. Next, click the plus sign next to the ticker at the top left of the chart to add symbols to compare.

tradingview plus icon

Finally, ensure you click the ‘ADJ’ at the bottom to adjust the returns for dividends!

tradingview adj icon

Related Articles

JEPI vs. JEPIX Compared

VTI vs. VOO ETFs Compared

FXAIX vs. VOO Funds Compared

The Best Robert Kiyosaki Books In Order

best robert kiyosaki books in order

Robert Kiyosaki is a fantastic businessman and entrepreneur, but he is most known for the gold nuggets for business that are contained in his Rich Dad Poor Dad series.

This article will show you the most valuable Robert Kiyosaki books in order of publication so you can take the first step in your business education.

Disclosure: This post contains affiliate links from Amazon and TradingView. As an Amazon Associate, I earn from qualifying purchases. This means that if you click on these links and make a purchase, I will receive a small commission at no extra cost to you.

Rich Dad Poor Dad (1997)

This is the book that started it all. Rich Dad Poor Dad is Robert Kiyosaki’s best-selling personal finance book that teaches you how to create wealth and financial freedom by following the advice of two different fathers: his own, who was poor and struggling, and his friend’s, who was rich and successful.

Regardless of how much you know about finance, this book will open your eyes to the world of business like no other. Check out our Rich Dad Poor Dad book review for more details.

Rich Dad’s CASHFLOW Quadrant: Rich Dad’s Guide to Financial Freedom (1998)

Rich Dad’s Cashflow Quadrant is the fantastic sequel to Robert’s previous hit: Rich Dad Poor Dad.

This time he teaches you about 4 Cash Flow Quadrants and how you can use them to get rich.

In this book, you will learn why you should aim to move from the left side of the quadrant (E and S) to the right side (B and I), where you can leverage other people’s time and money to create passive income and wealth.

Rich Dad Poor Dad: What The Rich Teach Their Kids About Money – That The Poor And Middle Class Do Not! (1998)

This is the updated and expanded version of Rich Dad Poor Dad, with new chapters and insights from Robert Kiyosaki. In this book, you will learn more about the principles and lessons that the rich teach their kids about money, such as how to think like an entrepreneur, how to use the power of leverage, and how to protect your assets from taxes and lawsuits.

You will also learn how to overcome the common myths and obstacles that prevent most people from achieving financial success.

Rich Dad Secrets to Money, Business, and Investing… and How You Can Profit From Them! (1999)

This is an audio program that features Robert Kiyosaki and his rich dad’s advisors sharing their secrets to money, business, and investing. In this program, you will learn how to find great opportunities in any market, how to raise capital for your business, create a winning business plan, negotiate like a pro, and grow your wealth exponentially.

Rich Dad’s Guide to Investing: What the Rich Invest in, That the Poor and the Middle Class Do Not! (2000)

This is the third book in the Rich Dad series, where Robert Kiyosaki reveals his secrets to investing like the rich.

In this book, you will learn how to invest in businesses to build a strong financial foundation, use corporations and trusts to protect your assets, and find mentors who can help you.

Rich Dad’s Guide to Becoming Rich Without Cutting Up Your Credit Cards: Turn “Bad Debt” into “Good Debt” (2000)

This is a short book that challenges the conventional wisdom of cutting up your credit cards and avoiding debt. Robert Kiyosaki explains that there are two types of debt: bad debt and good debt.

In this book, you will learn how to use good debt to create income and wealth, how to increase your credit score and borrowing power, how to avoid paying taxes on your debt, and how to use other people’s money to finance your dreams.

Rich Kid Smart Kid: Giving Your Child a Financial Head Start (2001)

This is a book that teaches parents how to give their children a financial head start in life. Robert Kiyosaki believes that financial education is not taught in schools, but it is essential for success in the real world.

In this book, you will learn how to instill in your children the values and habits of the rich, such as entrepreneurship, investing, saving, giving, and managing risk. You will also learn how to use games and activities to make learning fun and effective.

Rich Dad’s The Business School: For People Who Like Helping People (2001)

This is a book that introduces the concept of network marketing as a way of building a successful business and helping others. Robert Kiyosaki believes that network marketing is a powerful business model that can teach you valuable skills, such as leadership, communication, teamwork, and sales.

In this book, you will learn how to choose the right network marketing company, how to build a large and loyal customer base, leverage the power of duplication, and create multiple streams of income.

Retire Young Retire Rich: How to Get Rich Quickly and Stay Rich Forever! (2002)

This is a book that shares Robert Kiyosaki’s personal story of how he retired young and rich at the age of 47. In this book, you will learn how he achieved his financial goals by following the principles of the Rich Dad philosophy, such as increasing his financial intelligence, building a strong team, creating passive income, and using leverage.

You will also learn how he overcame the challenges and setbacks that he faced along the way, such as losing millions of dollars, facing lawsuits, and dealing with critics.

Rich Dad’s Success Stories: Real Life Success Stories from Real Life People Who Followed the Rich Dad Lessons (2003)

This is a book that features real life success stories from real life people who followed the Rich Dad lessons. In this book, you will read about ordinary people from different backgrounds and situations who applied the principles and strategies of Robert Kiyosaki to achieve extraordinary results.

You will learn how they changed their mindset, increased their financial literacy, started their own businesses, invested in real estate and stocks, created passive income, and achieved financial freedom.

Padre Rico, Padre Pobre (2003)

This is the Spanish edition of Rich Dad Poor Dad, the best-selling personal finance book that teaches you how to create wealth and financial freedom by following the advice of two different fathers: one who was poor and struggling and one who was rich and successful.

In this book, you will learn the difference between an asset and a liability, why you should build passive income streams, how to use debt to your advantage, and how to increase your financial literacy and intelligence.

Rich Dad Poor Dad for Teens: The Secrets about Money – That You Don’t Learn in School (2004)

This is a book that teaches teens the secrets about money that they don’t learn in school. Robert Kiyosaki believes that financial education is not taught in schools, but it is essential for success in the real world.

In this book, you will learn how to make money work for you, not against you; how to start your own business; how to invest in real estate and stocks; how to avoid scams and bad deals; and how to plan for your future.

Rich Dad’s Who Took My Money?: Why Slow Investors Lose and Fast Money Wins! (2004)

This is a book that exposes the hidden dangers of investing in the stock market and reveals the secrets of making fast money. Robert Kiyosaki explains that there are two types of investors: slow investors and fast investors.

Slow investors are those who buy and hold stocks, mutual funds, bonds, and other paper assets. They are often victims of market crashes, inflation, fees, taxes, and scams.

Fast investors are those who buy and sell businesses, real estate, commodities, options, and other tangible assets. They are often winners of market booms, deflation, cash flow, leverage, and tax advantages. In this book, you will learn how to become a fast investor who can beat the market and create wealth in any economy.

Rich Dad’s Escape from the Rat Race: How to Become a Rich Kid by Following Rich Dad’s Advice (2005)

This is a comic book that teaches kids how to escape from the rat race and become rich by following Rich Dad’s advice. In this book, you will follow the story of Timid T. Turtle, who is stuck in a boring job and a miserable life.

He meets Robert and his friends, who show him how to change his mindset, increase his financial literacy, start his own business, invest in real estate and stocks, create passive income, and achieve financial freedom.

Rich Dad’s Before You Quit Your Job: 10 Real-Life Lessons Every Entrepreneur Should Know About Building a Multimillion-Dollar Business (2005)

This is a book that shares Robert Kiyosaki’s personal story of how he quit his job and became a successful entrepreneur.

In this book, you will learn the 10 real-life lessons that every entrepreneur should know about building a multimillion-dollar business, such as how to find your mission and how to exit your business gracefully.

Why We Want You to Be Rich: Two Men – One Message (2006)

This is a book that features Robert Kiyosaki and Donald Trump sharing their insights on why they want you to be rich. In this book, you will learn how they became rich and successful by overcoming challenges and failures and how they view money.

Rich Dad’s Increase Your Financial IQ: Get Smarter with Your Money (2008)

This is a book that teaches you how to increase your financial IQ, which is your ability to make money, keep money, and grow money. Robert Kiyosaki believes that financial IQ is not something you are born with but something you can learn and improve.

In this book, you will learn the five components of financial IQ: making more money, protecting your money, budgeting your money, leveraging your money, and improving your financial information.

Rich Dad’s Conspiracy of the Rich: The 8 New Rules of Money (2009)

This is a book that exposes the conspiracy of the rich, which is the manipulation of money and power by the elite and the government. Robert Kiyosaki explains that the global financial crisis of 2008 was not an accident, but a planned event that benefited the rich at the expense of the poor and the middle class.

Be Rich And Happy (2010)

This is a book that teaches you how to be rich and happy by following your passion and purpose. Robert Kiyosaki believes that money alone cannot make you happy, but happiness can make you money.

In this book, you will learn how to find your passion and purpose in life, how to turn your passion into profit, how to overcome fear and doubt, how to balance work and play, and how to live a rich and fulfilling life.

The Business of the 21st Century (2010)

This is a book that introduces the concept of network marketing as the business of the 21st century. Robert Kiyosaki believes that network marketing is a revolutionary business model that can create financial freedom and personal growth for anyone who is willing to learn and work hard.

Midas Touch: Why Some Entrepreneurs Get Rich-And Why Most Don’t (2011)

This is a book that features Robert Kiyosaki and Donald Trump sharing their insights on why some entrepreneurs get rich and why most don’t. In this book, you will learn what it takes to have the Midas touch, which is the ability to turn anything into gold. You will learn the five factors that determine the success or failure of any entrepreneur: strength of character, focus, brand, relationships, and little things that count.

Why “A” Students Work for “C” Students and “B” Students Work for the Government (2012)

This is a book that challenges the conventional wisdom of the education system and reveals the secrets of financial success. Robert Kiyosaki explains that the education system is designed to produce employees, not entrepreneurs; to teach obedience, not creativity; and to reward academic intelligence, not financial intelligence.

Second Chance: for Your Money, Your Life and Our World (2015)

This is a book that offers you a second chance to change your life and your world by understanding the past, the present, and the future of money. Robert Kiyosaki believes that we are living in a time of crisis and opportunity, where the old rules of money no longer apply and the new rules are yet to be written.

In this book, you will learn how to see the past with new eyes, how to understand the present with an open mind, and how to create the future with a clear vision.

8 Lessons in Military Leadership for Entrepreneurs (2015)

This is a book that teaches you how to apply the principles of military leadership to your entrepreneurial endeavors. Robert Kiyosaki, who is a former Marine Corps pilot and Vietnam veteran, shares his 8 lessons in military leadership that he learned from his mentors and experiences in the military.

Rich Dad’s Guide to Becoming Rich without Cutting up Your Credit Cards: Turn Bad Debt into Good Debt (2015)

This is an updated edition of Rich Dad’s Guide to Becoming Rich without Cutting up Your Credit Cards: Turn Bad Debt into Good Debt (2000), which challenges the conventional wisdom of cutting up your credit cards and avoiding debt.

Robert Kiyosaki explains that there are two types of debt: bad debt and good debt. Bad debt is debt that makes you poorer, such as consumer debt or car loans. Good debt is debt that makes you richer, such as business debt or investment debt.

More Important Than Money: an Entrepreneur’s Team (2017)

This is a book that features Robert Kiyosaki and his team of experts sharing their insights on why an entrepreneur’s team is more important than money.

In this book, you will learn how to build a team of advisors who can help you with different aspects of your business, such as accounting, legal, tax, marketing, sales, operations, technology, and leadership.

Why The Rich Are Getting Richer (2017)

This is a book that explains why the rich are getting richer and the poor and the middle class are getting poorer in the current economy. Robert Kiyosaki believes that the gap between the rich and the rest is widening due to the changes in money, taxes, debt, and education.

FAKE: Fake Money, Fake Teachers, Fake Assets: How Lies Are Making the Poor and Middle Class Poorer (2019)

This is a book that exposes the fake money, fake teachers, and fake assets that are making the poor and middle class poorer. Robert Kiyosaki believes that we are living in a world of fake news, fake information, and fake experts who are misleading us and keeping us in ignorance.

Who Stole My Pension?: How You Can Stop the Looting (2020)

This is a book that reveals the looming crisis of pension theft and how you can stop it. Robert Kiyosaki and Edward Siedle, who are both experts on pensions and retirement planning, warn that millions of workers and retirees are at risk of losing their pensions due to mismanagement, corruption, fraud, and greed.

Capitalist Manifesto (2022)

This is a book that advocates for capitalism as the best system for creating wealth and prosperity for all. Robert Kiyosaki believes that capitalism is under attack by socialism, which is a system that promotes dependency, mediocrity, and inequality.

The Ultimate Rich Dad Library: To Elevate the Financial Well-Being of Humanity (2022)

This is a book that contains all of Robert Kiyosaki’s books in one volume. The Ultimate Rich Dad Library is a comprehensive collection of Robert Kiyosaki’s wisdom and experience on financial education, entrepreneurship, investing, leadership, and personal development.

In this book, you will have access to all of Robert Kiyosaki’s best-selling books, such as Rich Dad Poor Dad, Cashflow Quadrant, Guide to Investing, Conspiracy of the Rich, Second Chance, Fake Money Fake Teachers Fake Assets Capitalist Manifesto, and many more.

You will also have access to his latest books on topics such as cryptocurrency, artificial intelligence, biotechnology, quantum computing, and space exploration. The Ultimate Rich Dad Library is a book that will elevate your financial well-being and help you achieve your financial dreams.

best robert kiyosaki books in order
Source: Indie’s Education

The Best Robert Kiyosaki Books: Bottom Line

Robert Kiyosaki has helped millions of entrepreneurs start a business career or a business in general.

He has also helped millions of people interested in learning more about finances through his 20 different finance books.

He is a great author for people who want to learn more about money and how to use that information to start their business ventures. However, Kiyosaki is known to be skeptical of the stock market and using technical indicators to make money.

I also have articles that cover the best options trading books and the best trading books!

FAQ

Is Rich Dad Poor Dad worth reading?

The book is worth reading if you want to learn about the difference between assets and liabilities, the importance of financial literacy and cash flow, and the mindset of the rich versus the poor and the middle class.

What order should I read Robert Kiyosaki books?

There is no fixed order to read Robert Kiyosaki books, as each book covers different topics and aspects of financial education. However, a possible order could be:

  • Start with Rich Dad Poor Dad, as it introduces the basic concepts and principles of Kiyosaki’s philosophy.
  • Follow up with Cashflow Quadrant, as it expands on the four types of income earners and how they relate to taxes and wealth creation.
  • Read Rich Dad’s Guide to Investing, as it explains how to build a portfolio of assets that generate passive income.
  • Continue with Rich Dad’s Retire Young Retire Rich, as it shows how to achieve financial freedom at any age by increasing your cash flow and reducing your expenses.
  • Learn from Rich Dad’s Increase Your Financial IQ, as it teaches how to improve your financial intelligence and skills in areas such as debt management, risk management, budgeting, investing, and entrepreneurship.
  • Choose any other books that interest you or suit your needs and goals.

Why is Rich Dad Poor Dad so controversial?

Rich Dad Poor Dad is a controversial book because it challenges some of the conventional wisdom and common beliefs about money and investing. Some of the controversial ideas in the book include:

  • The rich don’t work for money; they make money work for them.
  • Your house is not an asset; it is a liability.
  • Savers are losers; debtors are winners.
  • The rich pay less taxes than the poor and the middle class.
  • You don’t need a high income to be rich; you need a high cash flow.
  • You don’t need a college degree to be successful; you need financial education.
  • You don’t need a job to be secure; you need passive income.

These ideas may sound appealing or empowering to some people, but they may also sound unrealistic, irresponsible, or unethical to others. The book also does not provide any solid evidence or data to support its claims, and relies mostly on anecdotes and opinions. The book also contains some factual errors, logical flaws, and questionable advice that may mislead or harm the readers.

What does Rich Dad Poor Dad teach you?

Rich Dad Poor Dad teaches you some of the key principles and lessons that the author learned from his Rich Dad, his friend’s father who was a wealthy investor.

Before you go

If you want to keep educating yourself about personal finance, you must check out these posts as well:

What is the Most Successful Options Strategy

Options Trading for Income: The Complete Guide

Mark Minervini’s Trading Strategy: 8 Key Takeaways

The Best Options Trading Books

TradingView Pricing Guide

The Best Laptops and Computers for Trading

The Best Monitors for Trading

How to Get a TradingView Free Trial

The Best TradingView Indicators

This article contains affiliate links I may be compensated for if you click them.

The 7 Best ETFs to Buy Now in 2024

best etfs to buy now

Buying ETFs is the simplest and safest way to invest in the stock market. Continue reading to discover the best and lowest-cost ETFs to put your investment strategy on auto pilot. 

best etfs to buy now

The Best ETFs to Invest In

1- VOO

VOO is the Vanguard S&P 500 fund and is arguably the most popular due to its low-cost and Vanguard’s excellent reputation. The S&P 500 provides exposure to the top 500 large-cap U.S. stocks. 

  • Expense Ratio: 0.03%

2- VTI

VTI is the Vanguard Total Stock Market Fund and is great for those who want more diversity than the S&P 500. VTI provides exposure to nearly every U.S. stock, from small to large-cap companies. 

  • Expense Ratio: 0.03%

3- VIG

VIG is the Vanguard dividend growth fund and is great for those seeking exposure to dividend-appreciating companies. VIG is a great mix of capital growth potential and consistent dividend income. 

  • Expense Ratio: 0.06%

4- SCHD

SCHD is the Schwab US Dividend Equity ETF and tracks 100 companies with stable dividend payments and good fundamentals. SCHD is great for dividend investors seeking a high dividend yield investment strategy. 

  • Expense Ratio: 0.06%

5- JEPI

JEPI is the JP Morgan Equity Premium Income ETF and utilizes a covered call strategy to generate income. JEPI is known for its high monthly dividend payments but is best used in a ROTH IRA since the dividends are taxed at your regular income rate.  

  • Expense Ratio: 0.35%

6- QQQ

QQQ is the Invesco Nasdaq 100 ETF designed to track the top 100 largest non-financial companies. QQQ provides investors with high capital growth potential and is more aggressive compared to the other ETFs on this list. 

  • Expense Ratio: 0.20%

ETF Comparison Tool – Financial Tech Wiz

fundcomparison

The Financial Tech Wiz ETF Comparison Tool

You can use the ETF comparison tool below to compare over 2,000 ETFs and mutual funds with data I manually collected:

Comparing ETFs Using TradingView

Another great way to compare ETFs is using TradingView with the chart below. You can use the plus icon at the top left to add several assets to the chart like stocks, ETFs, crypto, futures, and more. You can adjust the data to include dividend payments by clicking the ADJ button at the bottom right.

You can sign up for a free TradingView account using the link below, and if you decide to upgrade later on, you will a $15 credit toward your subscription.

VTSAX vs. VFIAX | Which is Best For You?

vtsaxvsvfiaxtable

If you are looking for a low-cost and diversified way to invest in the U.S. stock market, you may have come across two popular index funds from Vanguard: VTSAX and VFIAX.

Both of these funds offer broad exposure to the U.S. equity market, but they have some key differences that you should be aware of before choosing which one to invest in.

vtsaxvsvfiaxtable

Overview of VTSAX and VFIAX

VTSAX (Vanguard Total Stock Market Index Fund Admiral Shares) is a total stock market index fund, meaning that it holds a slice of every publicly traded company in the U.S. stock market.

This makes it the most diversified fund available, as it holds about 3,800 stocks across all sectors and market capitalizations. VTSAX aims to track the performance of the CRSP US Total Market Index, which covers 100% of the investable U.S. equity market.

VFIAX (Vanguard 500 Index Fund Admiral Shares) is an S&P 500 index fund, meaning that it holds the 500 largest companies in the U.S. stock market.

This makes it still diversified, but less so than VTSAX, as it holds only about 13% of the total U.S. equity market. VFIAX aims to track the performance of the S&P 500 Index, which is widely regarded as the best single gauge of the U.S. equity market.

Both VTSAX and VFIAX are passively managed, meaning that they do not try to beat the market but rather match its performance. They also have very low expense ratios, which means that they charge very little fees to investors.

Both funds are suitable for long-term investors who want to capture the growth of the U.S. stock market, but they have different risk and return profiles that you should consider.

VTSAX vs. VFIAX Returns Comparison

vfiaxvsvtsax

One of the most important factors to consider when comparing VTSAX vs. VFIAX is their historical returns. How have these funds performed over time, and which one has delivered higher returns for investors?

The answer is that over the long term, VFIAX has slightly outperformed VTSAX by a small margin. VFIAX generated a bit more return than VTSAX over the past decade, but the difference was not very significant.

The reason why VFIAX has slightly outperformed VTSAX is that it is less diversified and, therefore, more concentrated in the large-cap segment of the market.

Large-cap stocks are generally more stable and profitable than small-cap and mid-cap stocks, and they have performed better in the past decade.

However, this does not mean that VFIAX will always outperform VTSAX, as there may be periods when small-cap and mid-cap stocks outperform large-cap stocks.

Comparing ETFs With TradingView

When comparing ETFs, it is crucial that you are comparing the total return to include dividend payments. TradingView allows you to compare several stocks and ETFs at once on a single chart adjusted for dividends.

You can simply sign up for a free TradingView account and type the stock ticker you want to compare. Next, click the plus sign next to the ticker at the top left of the chart to add symbols to compare.

tradingview plus icon

Finally, ensure you click the ‘ADJ’ at the bottom to adjust the returns for dividends!

tradingview adj icon

As you can see in the TradingView chart below, you can compare multiple funds and ETFs on a single chart, making your research much easier. Feel free to compare any ETFs you’d like using the widget.

tradingview banner

VTSAX vs. VFIAX Dividend Yield Compared

FundDividend Yield
VTSAX1.58%
VFIAX1.59%

Another factor to consider when comparing VTSAX vs. VFIAX is their dividend yield.

Both VTSAX and VFIAX pay dividends quarterly, and they have very similar dividend yields. The dividend yield for VTSAX is 1.58%, while the dividend yield for VFIAX is around 1.59%.

This means that both funds pay about the same amount of dividends to their investors, and they are not a major factor when comparing them.

VTSAX vs. VFIAX Expense Ratio Comparison

FundExpense Ratio
VTSAX0.04%
VFIAX0.04%

Another factor to consider when comparing VTSAX vs. VFIAX is their expense ratio. The expense ratio is the percentage of a fund’s assets that are used to cover its operating expenses, such as management fees, administrative costs, and marketing expenses.

The expense ratio is important because it reduces the fund’s net return to investors, and it can have a significant impact on the fund’s performance over time.

Both VTSAX and VFIAX have very low expense ratios, which is one of their main advantages over other funds. The expense ratio for both VTSAX and VFIAX is 0.04%.

This means that for every $10,000 invested in either fund, you would pay only $4 in annual fees. This is much lower than the average expense ratio of 0.82% for U.S. equity funds, and it makes both funds very cost-efficient.

VTSAX vs. VFIAX Holdings Comparison

Another factor to consider when comparing VTSAX vs. VFIAX is their holdings. Their holdings are important because they affect the fund’s risk and return characteristics, as well as its diversification and correlation with the market.

VTSAX is a total stock market fund, and it holds around 3,800 companies across all sectors and market capitalizations.

VFIAX is an S&P 500 fund, and it holds around 500 companies that represent the largest and most influential companies in the U.S. stock market.

Both VTSAX and VFIAX have similar top holdings, as they are mostly composed of the same large-cap companies. However, VTSAX also holds many more small-cap and mid-cap companies, which gives it more exposure to different sectors and industries.

Both VTSAX and VFIAX are diversified enough to be a core investment holding, but VTSAX will be a bit less volatile than VFIAX, as it holds more companies.

The Financial Tech Wiz ETF Comparison Tool

You can use the ETF comparison tool below to compare over 2,000 ETFs and mutual funds with data I manually collected:

VTSAX vs. VFIAX Minimum Investment

Both VTSAX and VFIAX have a minimum investment of $3,000, which means that you need to have at least that amount of money to invest in either fund.

This can be a barrier for some investors who want to start investing with a smaller amount of money or who want to diversify their portfolio with multiple funds.

However, there is a way to invest in VTSAX and VFIAX with as little as a few dollars, and that is by using their ETF versions.

VTSAX vs. VFIAX ETF Versions

An ETF, or exchange-traded fund, is a type of fund that trades on an exchange like a stock and that tracks the performance of an underlying index or asset. ETFs have many advantages over mutual funds, such as lower fees, higher liquidity, and more tax efficiency.

VTI (Vanguard Total Stock Market ETF) is the ETF version of VTSAX, and it aims to track the same index as VTSAX.

VOO (Vanguard S&P 500 ETF) is the ETF version of VFIAX, and it aims to track the same index as VFIAX, the S&P 500 Index.

Both VTI and VOO have the same holdings, returns, dividends, and risk profiles as their mutual fund counterparts, VTSAX and VFIAX.

However, one difference is that VTI and VOO have slightly lower expense ratios than VTSAX and VFIAX. The expense ratio for both VTI and VOO was 0.03%, while the expense ratio for both VTSAX and VFIAX was 0.04%.

This means that for every $10,000 invested in either ETF, you would pay only $3 in annual fees, which is $1 less than the mutual fund versions.

Another difference is that VTI and VOO have no minimum investment, unlike VTSAX and VFIAX, which have a minimum investment of $3,000.

The most significant difference is that VTI and VOO can be purchased with fractional shares, which means that you can buy a fraction of a share of either ETF, such as 0.1 or 0.01.

etf vs mutual fund

Fractional shares allow you to invest any amount of money that you want, regardless of the share price of the ETF. This makes it even more accessible and flexible for investors who want to invest in VTSAX and VFIAX.

Fractional shares are not available for all brokers, but one of the best ones that offer this feature is tastytrade. Additionally, tastytrade usually offers a cash sign-up when you open a new account. You can check out this tastytrade referral code article for more information!

VTSAX vs. VFIAX - Determine Which One is Best For You!

Now that you have learned about the differences and similarities between VTSAX and VFIAX and their ETF versions, VTI and VOO, you may be wondering which one is best for you.

Ultimately, both VTSAX and VFIAX are excellent funds that offer low-cost and diversified exposure to the U.S. stock market. They are both suitable for long-term investors who want to capture the growth of the U.S. economy, and they have both delivered impressive returns over time.

However, if you have to choose one, you may want to consider the following factors:

  • If you prefer more diversification and more exposure to small-cap and mid-cap stocks, you may want to choose VTSAX, as it holds more companies and covers more sectors and industries than VFIAX.
  • If you prefer more exposure to large-cap stocks, you may want to choose VFIAX, as it holds fewer companies and is more concentrated in the large-cap segment of the market than VTSAX.
  • If you prefer more flexibility and more accessibility, you may want to choose VTI or VOO, as they have slightly lower fees, no minimum investment, and fractional shares than VTSAX and VFIAX.

Whatever you choose, you can’t go wrong with either VTSAX or VFIAX or their ETF versions, VTI or VOO. They are all great funds that can help you achieve your financial goals and grow your wealth over time.

Related Articles

JEPI vs. JEPIX

Anchored VWAP

TrendSpider vs. TradingView

VTI vs. VOO

FXAIX vs. VOO

Russell 1000 vs. 2000 vs. 3000

JEPI vs. JEPIX | Which is Best For You?

jepivsjepix

If you are looking for a fund that tracks a basket of stocks and uses a covered call strategy to generate income and pay out monthly dividends, you might have come across JEPI and JEPIX.

These two funds are essentially the same, except JEPI is an exchange-traded fund (ETF) while JEPIX is a mutual fund.

JEPIX has a higher expense ratio as well, but otherwise, the funds are nearly identical.

jepivsjepix

JEPI vs. JEPIX Minimum Investment

One of the main differences between JEPI and JEPIX is the minimum investment required to buy them.

JEPI has no minimum investment, which means you can buy as many or as few shares as you want. If your broker offers fractional shares, you can invest with as little as $1.

JEPIX, on the other hand, has a minimum investment of $1,000,000, making it only available to high net worth investors or institutional clients.

JEPI vs. JEPIX Dividend

Both JEPI and JEPIX pay monthly dividends to their shareholders, which can provide a steady stream of income.

The dividend yield of both funds varies between 6% – 12% depending on the market conditions and the performance of the underlying stocks.

However, these yields are not guaranteed and will always fluctuate.

JEPI vs. JEPIX Fees & Expenses

FundExpense Ratio
JEPI0.35%
JEPIX0.60%

Another difference between JEPI and JEPIX is the fees and expenses that they charge to their investors.

JEPIX has a higher expense ratio than JEPI, which means it costs more to run the fund. JEPI has an expense ratio of 0.35%, while JEPIX has an expense ratio of 0.60%.

This means that for every $10,000 invested in each fund, JEPI would charge $35 while JEPIX would charge $60 per year.

JEPI vs. JEPIX Total Return Performance

Despite the differences in fees and expenses, both JEPI and JEPIX have generated nearly identical returns since their inception.

The slight difference in performance may be attributed to the difference in fees and expenses, as well as the timing and execution of the covered call strategy.

jepivsjepixcomparison
Image From JP Morgan Website

Comparing ETFs With TradingView

When comparing ETFs, it is crucial that you are comparing the total return to include dividend payments. TradingView allows you to compare several stocks and ETFs at once on a single chart adjusted for dividends.

You can simply sign up for a free TradingView account and type the stock ticker you want to compare. Next, click the plus sign next to the ticker at the top left of the chart to add symbols to compare.

tradingview plus icon

Finally, ensure you click the ‘ADJ’ at the bottom to adjust the returns for dividends!

tradingview adj icon

As you can see in the TradingView chart below, you can compare multiple funds and ETFs on a single chart, making your research much easier. Feel free to compare any ETFs you’d like using the widget.

JEPI vs. JEPIX Holdings

Both JEPI and JEPIX have nearly identical allocations and holdings, as they both track the same basket of stocks from the S&P 500 index.

Other ETF Comparisons

If you are interested in comparing other ETFs that use a covered call strategy or offer high dividend yields, you can check out our other articles, such as:

The Financial Tech Wiz ETF Comparison Tool

You can use the ETF comparison tool below to compare over 2,000 ETFs and mutual funds with data I manually collected:

JEPI vs. JEPIX | Bottom Line

JEPI and JEPIX are both funds that track a basket of stocks from the S&P 500 index and use a covered call strategy to generate income and pay out monthly dividends.

They are essentially the same fund, except JEPI is an ETF while JEPIX is a mutual fund.

JEPI has no minimum investment, while JEPIX has a minimum investment of $1,000,000.

JEPIX has a higher expense ratio than JEPI, which means it costs more to run the fund.

Both funds pay monthly dividends, but the yield varies depending on the market conditions and the performance of the underlying stocks.

If you are looking for a fund that offers a high dividend yield and a covered call strategy, you might want to consider JEPI or JEPIX, depending on your investment goals and preferences.

However, you should also be aware of the risks and limitations of this strategy, such as the potential for lower capital appreciation, higher volatility, and tax implications.

If you want to learn more about JEPI and JEPIX or compare them with other funds, you can sign up for TradingView, a platform that allows you to track all markets from a single place easily.

tradingview banner

You can also use TradingView to create charts, indicators, alerts, and more to enhance your trading and investing experience. If you sign up using my affiliate link, you can get a discount on your subscription.

Disclaimer: Financial Tech Wiz is an affiliate of TradingView and will be compensated if you sign up and purchase a TradingView subscription using our link.

QQQ vs. SPY | Which is Best For You?

QQQ-vs-spy

If you are looking for a way to invest in the U.S. stock market, you might have come across two of the most popular and liquid exchange-traded funds (ETFs): QQQ and SPY.

These ETFs offer the best liquidity for active traders, as they have high trading volumes and low bid-ask spreads.

But what are the differences between them, and which one is best for you?

QQQ-vs-spy

Overview of QQQ and SPY

QQQ and SPY are both index funds, which means they track the performance of a specific group of stocks. However, they track different indexes, which have different compositions and characteristics.

SPY tracks the S&P 500 index, which is the most common benchmark of the U.S. stock market. The S&P 500 index consists of 500 large-cap companies from various sectors, such as technology, health care, consumer discretionary, financials, and more.

The S&P 500 index is weighted by market capitalization, which means that larger companies have a bigger impact on the index performance.

QQQ tracks the Nasdaq 100 index, which holds only 100 stocks. The Nasdaq 100 index is also weighted by market capitalization, but it has a different sector allocation than the S&P 500 index.

The Nasdaq 100 index is heavily skewed towards technology companies, which make up about 50% of the index. The Nasdaq 100 index also excludes financial companies, which are more prevalent in the S&P 500 index.

QQQ vs. SPY Dividend Yield

ETFDividend Yield
SPY1.53%
QQQ0.59%

One of the factors that investors consider when choosing an ETF is the dividend yield, which is the annual dividend payment divided by the share price. Dividends are a way for companies to distribute their profits to shareholders, and they can provide a steady income stream for investors.

The QQQ dividend yield is 0.59%, while the SPY dividend yield is 1.53%. This means that SPY pays more dividends than QQQ on average.

This is partly because SPY has more mature and stable companies that tend to pay higher dividends, while QQQ has more growth-oriented and innovative companies that tend to reinvest their earnings.

QQQ vs. SPY Expense Ratio

ETFExpense Ratio
SPY0.09%
QQQ0.20%

Another factor that investors consider when choosing an ETF is the expense ratio, which is the annual fee that the fund charges to cover its operating costs. The expense ratio reduces the net return of the fund, so lower expense ratios are preferable.

The QQQ expense ratio is 0.20%, while the SPY expense ratio is 0.09%. This means that SPY charges less fees than QQQ on average. This is partly because SPY has a simpler structure and lower management costs than QQQ, which has more complex holdings and higher turnover rates.

However, both QQQ and SPY have relatively low expense ratios compared to other ETFs in the market. For example, some Vanguard ETFs have even lower expense ratios, such as VOO (0.03%), VTI (0.03%), and VUG (0.04%).

qqq-vs-spy-total-return

QQQ vs. SPY Total Return Performance

ETF5-Year Total Return
SPY59%
QQQ104%

One of the most important factors that investors consider when choosing an ETF is the total return performance, which is the change in share price plus the dividends received over a period of time. The total return performance reflects how well the fund has performed in terms of capital appreciation and income generation.

The QQQ 5-year total return is 104%, while SPY is 59%. This means that QQQ has outperformed SPY by a wide margin over the past five years. This is mainly because QQQ has benefited from the strong performance of its top holdings, such as Apple, Microsoft, Amazon, Tesla, and Google, which have been driving the technology sector to new heights due to their innovation and growth potential.

However, past performance does not guarantee future results, and QQQ may also face higher volatility and risk than SPY due to its concentration in a few sectors and companies.

Comparing ETFs With TradingView

When comparing ETFs, it is crucial that you are comparing the total return to include dividend payments. TradingView allows you to compare several stocks and ETFs at once on a single chart adjusted for dividends.

You can simply sign up for a free TradingView account and type the stock ticker you want to compare. Next, click the plus sign next to the ticker at the top left of the chart to add symbols to compare.

tradingview plus icon

Finally, ensure you click the ‘ADJ’ at the bottom to adjust the returns for dividends!

tradingview adj icon

As you can see in the TradingView chart below, you can compare multiple funds and ETFs on a single chart, making your research much easier. Feel free to compare any ETFs you’d like using the widget.

QQQ vs. SPY Holdings Comparison

Another way to compare QQQ and SPY is to look at their holdings, which are the individual stocks that make up each fund. By looking at their holdings, you can get a better sense of their diversification, exposure, and risk profile.

Here are some key facts about QQQ and SPY holdings:

  • QQQ has 100 holdings, while SPY has 500 holdings on average.
  • QQQ has no exposure to the financial sector, while SPY has significant exposure to the financial sector.
  • SPY is considered the benchmark for the general U.S. stock market.

Other ETF Comparisons

If you are interested in comparing other ETFs, you can check out our other articles, such as:

The Financial Tech Wiz ETF Comparison Tool

You can use the ETF comparison tool below to compare over 2,000 ETFs and mutual funds with data I manually collected:

QQQ vs. SPY | Bottom Line

QQQ and SPY are both excellent ETFs that offer exposure to the U.S. stock market, but they have different characteristics and performance. QQQ is more suitable for investors who are looking for higher growth potential and are willing to accept higher risk and volatility. SPY is more suitable for investors who are looking for more stability and income and are more diversified across sectors and companies.

Ultimately, the best ETF for you depends on your personal goals, risk tolerance, time horizon, and investment strategy. You can also combine QQQ and SPY in your portfolio to achieve a balanced mix of growth and value.

To help you make informed decisions and track your investments, we recommend you to sign up for TradingView, which is a powerful platform that allows you to easily track all markets from a single platform. You can get a TradingView free trial when you use our affiliate link.

VTI vs. VOO | Which is Best For You?

voo vs vti

If you are looking for a simple and effective way to invest in the stock market, you might have come across two popular exchange-traded funds (ETFs) from Vanguard: VTI and VOO.

Both of these ETFs provide exposure to the overall stock market, but they have some key differences that you should be aware of before choosing one over the other.

voo vs vti

Overview of VTI and VOO

VTI and VOO are both ETFs from Vanguard, one of the largest and most reputable investment companies in the world. ETFs are funds that track a basket of securities, such as stocks or bonds, and trade on an exchange like stocks.

VTI stands for Vanguard Total Stock Market ETF, and it aims to track the performance of the CRSP US Total Market Index, which covers the entire US equity market. VTI holds over 3,800 stocks across all market capitalizations, sectors, and styles, making it one of the most diversified ETFs available.

VOO stands for Vanguard S&P 500 ETF, and it aims to track the performance of the S&P 500 Index, which is widely regarded as the best representation of the US large-cap stock market. VOO holds around 500 stocks that are selected by the S&P Dow Jones Indices based on their size, liquidity, profitability, and other factors.

VTI vs. VOO Dividend Yield

ETFDividend Yield
VTI1.56%
VOO1.61%

Dividends are payments that companies make to their shareholders as a way of distributing their profits. Dividend yield is a measure of how much a company pays in dividends relative to its share price.

Both VTI and VOO pay dividends quarterly to their investors. The dividend yield for VTI is around 1.56%, while the dividend yield for VOO is around 1.61%. This means that if you invested $10,000 in VTI or VOO at that date, you would receive about $156 or $161 in dividends per year, respectively.

The difference in dividend yield between VTI and VOO is not very significant and is not a huge deciding factor between these ETFs.

VTI vs. VOO Expense Ratio

ETFExpense Ratio
VTI0.03%
VOO0.03%

VTI and VOO both have an expense ratio of 0.03%, which is among the lowest in the industry. This means that both ETFs are very cost-efficient and do not erode your returns significantly due to fees.

The expense ratio is a measure of how much an ETF charges its investors for managing the fund. It is expressed as a percentage of the fund’s assets per year. For example, an expense ratio of 0.03% means that the fund charges $3 per year for every $10,000 invested.

The expense ratio is one of the most important factors to consider when choosing an ETF because it directly affects your returns over time. The lower the expense ratio, the more money you get to keep from your investment.

VTI vs. VOO Total Return Performance

ETF5-Year Return of $10,000
VTI$15,600
VOO$16,100

According to TradingView, which is a platform that allows you to compare several stocks and ETFs on a single chart with various indicators and tools, VTI has generated a total return of 56% over the past five years, while VOO has generated a total return of 61% in the same time period.

vti vs voo total return

This means that if you invested $10,000 in VTI or VOO five years ago, you would have $15,600 or $16,100 today, respectively.

The difference in total return performance between VTI and VOO is mainly due to the fact that VOO holds fewer companies than VTI, and those companies have performed better than the average of the entire market.

VOO is more concentrated in the large-cap segment of the market, which has outperformed the small-cap and mid-cap segments in recent years. VOO also has a higher exposure to the technology sector, which has been one of the best-performing sectors in the past decade.

However, it is important to note that past performance is not a guarantee of future results and that the difference in total return performance between VTI and VOO may change over time depending on market conditions and trends.

Comparing ETFs With TradingView

When comparing ETFs, it is crucial that you are comparing the total return to include dividend payments. TradingView allows you to compare several stocks and ETFs at once on a single chart adjusted for dividends.

You can simply sign up for a free TradingView account and type the stock ticker you want to compare. Next, click the plus sign next to the ticker at the top left of the chart to add symbols to compare.

tradingview plus icon

Finally, ensure you click the ‘ADJ’ at the bottom to adjust the returns for dividends!

tradingview adj icon

As you can see in the TradingView chart below, you can compare multiple funds and ETFs on a single chart, making your research much easier. Feel free to compare any ETFs you’d like using the widget.

VTI vs. VOO Holdings

VTI is more diversified than VOO since it is a total stock market ETF, while VOO is an S&P 500 ETF. VOO holds around 500 companies, while VTI holds over 3,800 stocks. This means that VTI covers more of the market than VOO and has a lower exposure to any single company or sector.

Another important note is that VOO is heavily allocated to the tech sector, which some investors may consider too risky. Therefore, if you are more risk-averse, VTI is likely the better option.

An ETF’s holdings are the individual securities that an ETF owns and tracks. Understanding the companies the ETF owns is one of the most important factors to consider when choosing an ETF because it determines the risk and return profile of the fund.

If you are interested in comparing other ETFs besides VTI and VOO, you can check out our other articles that cover various aspects of different ETFs, such as:

  • VOO vs. SPY: A comparison of two S&P 500 ETFs from Vanguard and SPDR.
  • VUG vs. QQQ: A comparison of two growth-oriented ETFs from Vanguard and Invesco.
  • VOO vs. QQQ: A comparison of two large-cap ETFs from Vanguard and Invesco that have different sector exposures.
  • FXAIX vs. VOO: A comparison of an S&P 500 index fund from Fidelity and an S&P 500 ETF from Vanguard.
  • VOO vs. SCHD: A comparison of two dividend-focused ETFs from Vanguard and Schwab.
  • QQQ vs. SPY: Which is the best ETF for your portfolio?
  • VFIAX vs. VOO: Which is best for you?
  • VTSAX vs. VFIAX

The Financial Tech Wiz ETF Comparison Tool

You can use the ETF comparison tool below to compare over 2,000 ETFs and mutual funds with data I manually collected:

VTI vs. VOO | Bottom Line

VTI and VOO are both excellent ETFs from Vanguard that provide exposure to the overall stock market, but they have some key differences that you should be aware of before choosing one over the other.

VTI is a total stock market ETF that holds over 3,800 stocks across all market capitalizations, sectors, and styles, making it one of the most diversified ETFs available. VTI has a lower dividend yield, a lower exposure to large-cap growth stocks, and a higher exposure to small-cap and mid-cap stocks than VOO.

VOO is an S&P 500 ETF that holds around 500 stocks that are selected by the S&P Dow Jones Indices based on their size, liquidity, profitability, and other factors. VOO has a higher dividend yield, a higher exposure to large-cap growth stocks, and a lower exposure to small-cap and mid-cap stocks than VTI.

Both ETFs have the same expense ratio of 0.03%, which is among the lowest in the industry and have performed very well over the past five years, generating impressive total returns for their investors.

The choice between VTI and VOO depends on your personal preference, risk tolerance, investment horizon, and portfolio allocation. You may also consider holding both ETFs in your portfolio to get the best of both worlds.

VUG vs. VOO | Which is Best For You?

vug vs voo

If you are looking for a low-cost way to invest in the US stock market, you might have come across two popular exchange-traded funds (ETFs) from Vanguard: VOO and VUG.

Both of these funds offer exposure to large-cap US companies, but they have different investment objectives and strategies.

In this article, we will compare VUG vs. VOO in terms of their dividend yield, expense ratio, total return performance, holdings, and more. By the end of this article, you should have a better idea of which fund is best suited for your portfolio and risk profile.

vug vs voo

Overview of VUG and VOO

VOO and VUG are both ETFs that are managed by Vanguard, one of the largest and most reputable investment companies in the world. VOO stands for Vanguard S&P 500 ETF, while VUG stands for Vanguard Growth ETF.

VOO tracks the performance of the S&P 500 Index, which is widely regarded as the best representation of the US stock market. The S&P 500 Index consists of 500 of the largest and most influential companies in the US across various sectors and industries.

VOO aims to replicate the index by holding all or a representative sample of its constituents with similar weights and proportions. VOO is great for investors who want to diversify their portfolio into 500 of the best US companies and benefit from their long-term growth potential.

VUG tracks the performance of the CRSP US Large Cap Growth Index, which is a subset of the CRSP US Large Cap Index. The CRSP US Large Cap Growth Index consists of large-cap US companies that exhibit above-average growth characteristics, such as high earnings growth, high sales growth, high return on equity, and high expected earnings growth.

VUG aims to replicate the index by holding all or a representative sample of its constituents with similar weights and proportions. VUG is best suited for investors who are looking for higher returns but also higher volatility, as growth stocks tend to outperform value stocks in bullish markets but underperform in bearish markets.

VUG vs. VOO Total Return Performance

Perhaps the most important factor to consider when comparing VUG and VOO is their total return performance. Total return is the change in value of an investment over a given period of time, including any dividends or capital gains distributions, expressed as a percentage. Total return is an indicator of how much an investment has grown or shrunk over time.

VUG has a total return (including dividends) of around 76% over the past five years, while VOO has a total return of around 60%. This means that VUG has outperformed VOO by around 16 percentage points in the past five years.

vug vs voo total return
VUG vs. VOO on TradingView

The reason why VUG has outperformed VOO is that the past five years have been extremely bullish for tech stocks, which make up more than half of VUG’s holdings. Tech stocks have benefited from the rapid growth of e-commerce, cloud computing, social media, artificial intelligence, and other disruptive technologies that have changed the way we live and work.

VOO, on the other hand, has a more balanced portfolio that includes companies from various sectors and industries, such as health care, consumer staples, financials, and energy.

However, this does not mean that VUG will always outperform VOO in the future. VOO will likely perform better than VUG in sideways and down markets, as it holds more companies that are less sensitive to economic cycles and market fluctuations. VOO also offers more diversification and lower risk than VUG, as it holds more than twice the amount of companies.

The chart above compares the total return performance of VUG and VOO over the past five years using data from TradingView. TradingView is a powerful platform that allows you to easily compare several ETFs on a single chart and even adjust the data for dividends so you can see the total return and not just the price return.

You can get a TradingView free trial when you use our link to sign up, but you can compare ETFs with a free account as well.

VUG vs. VOO Dividend Yield

​ETFDividend Yield
VUG0.56%
VOO1.48%

One of the main differences between VUG and VOO is their dividend yield. Dividend yield is the ratio of annual dividend payments to the current share price, expressed as a percentage. Dividend yield is an indicator of how much income an investor can expect to receive from holding a fund.

VOO has a dividend yield of 1.48%, which means that for every $100 invested in VOO, an investor can expect to receive $1.48 in dividends per year. VUG has a dividend yield of 0.56%, which means that for every $100 invested in VUG, an investor can expect to receive $0.56 in dividends per year.

The reason why VOO has a higher dividend yield than VUG is that VOO invests in more mature and stable companies that tend to pay higher dividends to their shareholders, while VUG invests in more growth-oriented companies that tend to reinvest their earnings back into their business for future expansion and innovation.

VUG vs. VOO Expense Ratios

ETFDividend Yield
VUG0.04%
VOO0.03%

Another important factor to consider when comparing VUG and VOO is their expense ratio. The expense ratio is the annual fee that a fund charges its investors for managing their assets, expressed as a percentage of the fund’s net assets. The expense ratio is an indicator of how much a fund costs to operate and maintain.

VOO has an expense ratio of 0.03%, which means that for every $100 invested in VOO, an investor pays $0.03 in fees per year. VUG has an expense ratio of 0.04%, which means that for every $100 invested in VUG, an investor pays $0.04 in fees per year.

Both VOO and VUG have very low expense ratios compared to the average expense ratio of US equity ETFs, which is around 0.44%. This means that both funds are very efficient and cost-effective ways to invest in the US stock market. Keeping expenses low is one of the reasons why Vanguard is so successful.

VUG vs. VOO Holdings

Another factor to consider when comparing VUG and VOO is their holdings. Holdings are the individual stocks that make up a fund’s portfolio. Holdings can reveal a lot about a fund’s investment strategy, risk profile, sector exposure, and diversification.

VOO is more diversified than VUG, as it holds 508 companies, while VUG holds 234 companies. This means that VOO has a lower concentration risk than VUG, as it spreads its assets across more companies and reduces the impact of any single company on its performance.

More than half of VUG’s holdings are within the technology sector, while VOO has around 28% allocated to technology. This means that VUG has a higher sector risk than VOO, as it depends more on the performance of one sector and is more vulnerable to any sector-specific shocks or trends.

Comparing ETFs With TradingView

When comparing ETFs, it is crucial that you are comparing the total return to include dividend payments. TradingView allows you to compare several stocks and ETFs at once on a single chart adjusted for dividends.

You can simply sign up for a free TradingView account and type the stock ticker you want to compare. Next, click the plus sign next to the ticker at the top left of the chart to add symbols to compare.

tradingview plus icon

Finally, ensure you click the ‘ADJ’ at the bottom to adjust the returns for dividends!

tradingview adj icon

As you can see in the TradingView chart below, you can compare multiple funds and ETFs on a single chart, making your research much easier. Feel free to compare any ETFs you’d like using the widget.

Explore Other ETF Comparisons

If you are interested in comparing other ETFs, you can check out our other articles such as:

The Financial Tech Wiz ETF Comparison Tool

You can use the ETF comparison tool below to compare over 2,000 ETFs and mutual funds with data I manually collected:

VUG vs. VOO | Bottom Line

VUG and VOO are both excellent ETFs that offer exposure to large-cap US companies, but they have different investment objectives and strategies.

VUG is best suited for investors who are looking for higher returns but also higher volatility, as it invests in growth stocks that tend to outperform value stocks in bullish markets but underperform in bearish markets.

VOO is great for investors who want to diversify their portfolio into 500 of the best US companies and benefit from their long-term growth potential and stable dividends.

Both VUG and VOO have very low expense ratios, which makes them very efficient and cost-effective ways to invest in the US stock market. However, they also have different dividend yields, total return performance, holdings, and sector exposure, which can affect their risk-reward profile and suitability for different investors.

Ultimately, the choice between VUG and VOO depends on your personal preference, risk tolerance, time horizon, and investment goals. You can also combine both funds in your portfolio to achieve a balance between growth and value or diversify into other ETFs that cover different market segments or regions.

If you want to easily track and compare all these ETFs and more, you can sign up for a TradingView free trial using our affiliate link.

TradingView is a powerful platform that allows you to access real-time data, charts, indicators, tools, and community insights for all markets from a single platform.

You can also create your own custom watchlists, alerts, strategies, and more. TradingView is compatible with any device and browser, so you can always stay on top of your investments wherever you are.