TradingView Review: Features, Pricing, and Reviews (2024)

tradingview review

TradingView is a popular online platform for traders and investors to analyze financial markets with charts and fundamental data. 

The free version of TradingView is great and offers nearly real-time data for major stocks and ETFs like SPY and AAPL. Plus, you can use it to chart all markets, including stocks, ETFs, futures, crypto, forex, and more, making it a one-stop shop for all types of traders. 

TradingView also offers premium plans with more features like the ability to get real-time data, advanced indicators like the volume profile, and access to multiple charts on a single layout. 

TradingView Review – Key Takeaways

After my several years of trading and using nearly every trading platform, I rate TradingView as the best overall charting software available thanks to its freemium model, the ability to track all markets on a single platform, a large selection of indicators, and the seamless performance it provides. You can create an account and use it entirely for free, and you can always upgrade to a paid plan later on if you feel it is necessary.

TradingView Pros and Cons

Pros

Track all markets, including stocks, ETFs, futures, crypto, and forex on a single platform

Real-time data is provided at no cost whenever possible, while most competitors are delayed on free accounts

The platform performance is extremely smooth and rarely experiences lag compared to competitors

You can connect with compatible brokers and utilize real-time data if you already pay for it

Cons

If you want consistent real-time data, you must purchase it directly from the exchanges for an additional fee

TradingView Pricing and Plans

TradingView is completely free to use but offers several paid subscription options, including:

  • Essential: 2 charts per tab, 5 indicators per chart, 20 price alerts, and 20 technical alerts.
  • Plus: 4 charts per tab, 10 indicators per chart, 100 price alerts, 100 technical alerts.
  • Premium: 8 charts per tab, 25 indicators per chart, 400 price alerts, 400 technical alerts.

Here is a table comparing the pricing of the different plans:

FreeEssentialPlusPremium
Cost (monthly)$0$14.95$29.95$59.95
Cost (annually)$0$155.40 (save 13.38%)$299.40 (save 16.69%)$599.40 (save 16.69%)
Charts per tab1248
Indicators per chart251025
Saved chart layouts1510Unlimited
Watchlists1UnlimitedUnlimitedUnlimited
Price alerts520100400
Technical alerts120100400
LinksFree trialFree trialFree trial

New users can usually test the paid plans by getting a TradingView free trial. You can view our TradingView plans comparison article for more information.

Who is TradingView Best For?

TradingView is best for anybody who trades stocks, futures, crypto, or forex and wants a single platform to chart all of these assets. Many other charting platforms charge for real-time data, but TradingView offers it for free wherever it can. This means even if you don’t pay for a TradingView plan, you can still use it for charting with nearly real-time data.

Utilizing TradingView’s Features

The main features of TradingView include charting, screeners, backtesting, economic calendars, alerts, watchlists, and more! All of these features are easy to access from the home screen, so let’s cover them in depth. 

TradingView Technical Analysis Charting Review

One of the best features of TradingView is the ability to chart all markets within a single platform, including assets like stocks, ETFs, futures, forex, cryptocurrencies, and more. 

Many brokerages offer charting, but generally, they are made for just one asset class. Additionally, brokerage charting platforms are usually an afterthought, while TradingView is designed for active traders seeking advanced charting tools. Therefore, many traders will place trades on a brokerage platform while using TradingView for charting. 

TradingView also allows you to code custom indicators and strategies with its proprietary Pine Script language. There are tons of TradingView indicators you can use for free by default, plus there are paid indicators like the volume profile you can use with a premium subscription. 

Using the TradingView Screeners

Another excellent feature TradingView offers is screeners for stocks, crypto, and forex. The TradingView Screener 2.0 is the most advanced one and is free to use; you just need to sign up for a free TradingView account. 

You can customize these screeners based on your preferences, allowing you to discover trading opportunities with ease.

For example, if you are an investor, you can scan for stocks based on fundamental data like P/E ratios and EPS. Active traders can also search for high-volatility stocks based on % change and volume. The ideas are endless with TradingView’s screeners, suiting both active and long-term traders. 

Backtesting on TradingView

TradingView allows you to backtest strategies with the bar replay feature and the strategy tester. The bar replay feature is available to free users and allows you to backtest trades directly on a live chart. 

The strategy tester is a way to backtest Pine Script coded strategies. There are some community-made strategies you can use, plus you can create your own. You can read our TradingView backtesting guide for more information. 

Settings Alerts on TradingView

TradingView allows you to set alerts on both price and technical indicators. For example, you can set an alert if an asset moves above or below a specific price, allowing you to stay on top of your positions even when you aren’t actively watching the charts. You can also set alerts based on indicators, which is especially useful for indicators that provide buy and sell signals like moving average crossovers.

TradingView’s Economic Calendar

TradingView has an economic calendar you can view right next to your chart while you trade, which is great for staying on top of market-moving news like Fed announcements and economic data releases. 

You can filter by country, allowing you to pick which news is most important to you. Another feature is you can select the high-importance filter, ensuring you only see significant news events on the calendar. 

tradingview economic calendar

Creating Watchlists on TradingView

You can create and view your watchlists on TradingView by clicking the icon at the top right corner. Once you click the watchlist icon, you can create new watchlists by using the plus icon. You can change to your other watchlists by clicking on the name of the watchlist you are currently viewing to toggle between them. 

tradingview watchlists

Accessing Real-Time Data

When it comes to active trading, having access to real-time data is essential. For most instruments, you can buy real-time data from the exchanges directly through TradingView. 

Note that a paid subscription does not include real-time data as it is a subscription cost ranging from $2-$10 per month. To learn more about real-time data on TradingView, check out our detailed article on the subject.

TradingView User Reviews

Overall, TradingView has many positive reviews but also some negative ones. It has an A+ BBB rating and tons of reviews on Trustpilot you can view. Here are some recent customer reviews from credible sources:

Positive Reviews

Positive TradingView reviews praise its intuitive layout, helpful customer support, and call it an essential one-stop shop for all trading information needs.

“Simply the best place to get all trading info you may ever need for any kind of trading, from the most conservative stocks to crypto. The ultimate one-stop solution for any tech analysis.” Vlad on Trustpilot on 19 Dec 2023

“This is a fantastic platform in my opinion. I’ve been using it for a few years now (both the web version & app) and have had no issues. Everything is extremely well laid out and easy to access. What I find especially great about it, is that is has features I didn’t even know I wanted until I was in need of them. Customer service has always been on point in my experience too, I usually get a response within 24 hours. Great job TradingView … keep it up!”Edward on Trustpilot on 17 July 2023

“Great software, great tools and community. But automatic payments were ON, after 2 years they billed me 190$. I opened a support ticket, and they refunded me within a few hours. Excellent support team and software!.” – Jochem on Trustpilot on 3 July 2023

Negative Reviews

Negative TradingView reviews complain about customer service being hard to reach. Many people have trouble finding how to contact support. According to Trustpilot, the support email for TradingView is: [email protected], and the phone number is: +1 833 247 1523.  

“No phone number or email provided on website and no way to talk with anyone for billing issue. Sign up for free trial and keeps withdrawing money from our account without our authorization. Ask to open a ticket for support, however, you have to go through the list which does not have your problem at all and they design the way you never reach to the last step to open a ticket. If they don’t want to talk with the customer, why they have a business?”JH on Trustpilot on 28 Nov 2023. 

TradingView Review – My Final Take

TradingView offers a wide range of tools and charts, an active community of traders, and flexible pricing options. It is definitely worth considering if you’re looking for a trading analysis platform.

The free version of the platform is great for casual investors and allows you to view most assets with nearly real-time data for free. 

If you are actively trading and require advanced indicators, more charts per layout, and real-time data, you should consider upgrading to a paid plan. 

When you sign up for TradingView using my link, new users can usually get a free trial and a discount on a premium subscription!

TrendSpider Review – Is It Worth Paying For? (2024)

trendspider review image

TrendSpider is an advanced charting and automated AI technical analysis platform built for traders. Over my several years of trading, I have used nearly every platform available, and I believe TrendSpider is one of the best for charting. Continue reading to learn more about TrendSpider and what to consider before spending money on it.

Pros and Cons of TrendSpider

Pros

Automated technical analysis features make charting easy

Seasonality trends help you spot which months a stock performs well

Track all markets, including stocks, ETFs, futures, crypto, and forex

Use up to 16 charts per layout, which is much higher than any competitor I have used

Cons

The web-based platform can feel clunky at times, while TradingView runs a bit smoother

A bit pricy when compared to competitors

TrendSpider Special Offer!

Exclusive Deal: 25% Discount with Code FTW25

Elevate Your Trading – Join TrendSpider Today!

  • AI-Powered Analysis
  • Automated Technical Analysis
  • 16 charts per layout
CLAIM YOUR 25% DISCOUNT

Review of TrendSpider Charting & Indicators

When it comes to charting on TrendSpider, it provides everything a trader would want, including over 200 indicators to choose from and the ability to have up to 16 charts on one layout. TrendSpider offers a plethora of drawing tools, plus the automated features will draw trendlines for you. 

The platform even has its own proprietary chart type called raindrop charts, which is essentially like a volume profile built into a candle. Another feature I like about TrendSpider is the ability to set anchor points. For example, you can set the anchor point at the lowest point on the chart so your volume by price and anchored VWAP only show you the most relevant volume data. 

The only downside I have noticed about TrendSpider is the platform can feel a bit laggy at times, but it is not bad enough to be a huge burden. However, it is something to note if your computer isn’t the fastest. 

trendspider chart

TrendSpider’s Automated Technical Analysis Features

One of the best features of TrendSpider is the automated technical analysis tools. Here are all of the automated tools that TrendSpider offers:

  • Fibonacci levels – automatically draws Fibonacci retracements on your chart. My experience using this tool was hit or miss. Sometimes it worked perfectly, but sometimes I would prefer it to have drawn the retracements in different spots.
trendspider auto fibonacci tool
  • Trend lines – automatically draws several trend lines on your chart so you never miss key trends. The auto trend lines features is awesome, and it definitely catches lines that the human eye could easily miss.
trendspider auto trendline tool
  • Candlestick patterns – automatically detects candlestick patterns such as Doji and hammer candles. The auto candlestick pattern recognition is hit or miss in my experience, but it doesn’t hurt to turn it on.
trendspider auto candle pattern tool
  • Chart patterns – automatically detect triangles, head and shoulders, channels, and more. The auto chart patterns tool works well most of the time in my experience using it.
trendspider auto chart pattern tool
  • Heatmap – detects areas of support and resistance based on historical levels. The heatmap tool is a great extension to volume by price and helps highlight key levels.
trendspider auto heatmap tool

Using TrendSpider’s Scanner

Another great feature of TrendSpider is the scanner it offers, which can be prompted with a GPT condition or from a list of parameters. If you prompt the GPT parameters correctly, scanning for your exact parameters takes much less time. 

For example, instead of manually adding a parameter to scan for stocks above the 200 SMA, you can simply type “above 200 SMA,” and it will add the parameter for you. In my experience, it actually works better than I expected, and I highly recommend you try it if you are looking for an easy scanner. 

trendspiderscanner1
trendspiderscanner2

Is TrendSpider Worth It?

While TrendSpider is a bit expensive compared to its competitors, I believe it is worth it for serious traders who want automated analysis and advanced indicators. You can also take advantage of my affiliate link to save 25% on your subscription. During the checkout process, enter the coupon code FTW25 to claim your 25% off discount! TrendSpider is incredibly innovative and offers proprietary features like raindrop charts and promptable scanners. 

TrendSpider Special Offer!

Exclusive Deal: 25% Discount with Code FTW25

Elevate Your Trading – Join TrendSpider Today!

  • AI-Powered Analysis
  • Automated Technical Analysis
  • 16 charts per layout
CLAIM YOUR 25% DISCOUNT

Learn how to get a TrendSpider discount by watching this video!

While TrendSpider is great, I still believe that TradingView is the best overall charting software for most people due to its freemium model and much lower plan prices for premium features. However, TrendSpider does have more to offer than TradingView if you are willing to pay the price for it. I recommend you try several charting software out and decide which suits your needs the best before committing to an annual plan.

TradingView Limited Time Offer!

Exclusive Deal: 30-Day FREE Premium Access + Bonus Credit

Don’t Miss Out – Sign up for TradingView Now!

  • Advanced Charts
  • Real-Time Data
  • Track all Markets
CLAIM YOUR FREE TRIAL

Keep in mind you can get a 30-day free trial of TradingView’s premium features when you use my affiliate link. Consider reading my article about TrendSpider vs. TradingView to continue your research. 

Related Articles

TrendSpider Pricing

TrendSpider Pricing – Is It Worth the Cost? (2024)

trendspider pricing

TrendSpider Annual Cost

TrendSpider Monthly Cost

How Much Does TrendSpider Cost?

TrendSpider costs $107 per month or $1,284 per year. However, you can save 25% off your subscription and pay just $80.25 per month or $481.50 annually when you use my affiliate link. You can also enter my promo code: FTW25, to receive the same 25% discount. 

trendspider pricing

Is TrendSpider Worth It?

TrendSpider is worth it if you like the option of having up to 16 charts per layout and real-time data included in the pricing.  TradingView charges $59 per month for its highest plan, which only comes with eight charts per layout, plus you still have to purchase additional real-time data. Consider reading my full review of TrendSpider before purchasing a subscription to learn more.

TrendSpider also comes with many additional features, such as automated technical analysis and its proprietary raindrop charts. Overall, TrendSpider offers more features than TradingView, but it costs more. I recommend trying both platforms and sticking with the one that you prefer most. You can read my article comparing TrendSpider and TradingView to learn more. 

trendspiderbannersignup
Get 25% Off TrendSpider Using the Code: FTW25

What is TrendSpider?

TrendSpider is an advanced charting platform you can use to track stocks, crypto, futures, forex, and more. Here are some of the main features of TrendSpider:

  • Advanced screeners – you can prompt the screener with sentences like “stocks above 200 SMA”
  • Proprietary raindrop charts – an advanced alternative to candlestick charts
  • Multiple charts per layout – use up to 16 charts on a single screen
  • Backtesting – no-code backtesting capabilities to test indicators, patterns, and more

Additional Resources About TrendSpider

What is a Fair Value Gap (FVG) in Trading?

fair value gap

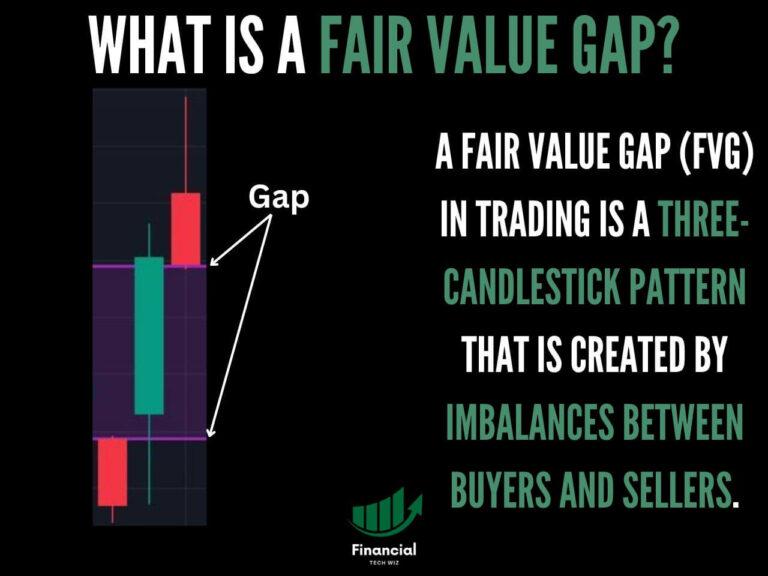
This article will show you how to identify, trade, and understand the fair value gap in trading. 

Fair Value Gaps Meaning Explained for Traders

A fair value gap (FVG) in trading is a three-candlestick pattern that is created by imbalances between buyers and sellers.

Like a regular gap, the fair value gap acts as a magnet, drawing the asset’s price to eventually fill the gap and repair the imbalance in the market.

An FVG can occur on any timeframe, from the 1-minute chart to the daily chart. 

fair value gap

How to Identify a Fair Value Gap

Identifying fair value gaps can be a difficult task, so let’s break it down step by step:

1- Find a Large Imbalance Candle

The first step to identifying a fair value gap is to find an abnormally large candle that causes a clear imbalance between buyers and sellers. Large candles can be caused by news, economic events, or volatile price action. The large candle can be either red or green. 

2- Identify the Fair Value Gap on the Chart

Once you identify the large candle, you must analyze the candles directly to the left and right. The highs and lows of these candles determine the fair value gap range, which we can draw on our TradingView charts with horizontal lines or a rectangle.

If the large candle is green, the fair value gap is defined as the area of the preceding candle’s high and the following candle’s low. Note that the neighboring candles should not significantly overlap the large candle, as in this case, there wouldn’t be much of a gap.  

Fair Value Gap Indicator

One of the best fair value gap indicators around is the LuxAlgo HTF Fair Value Gap on TradingView.

If you want to try this indicator out for free, you can sign up with our TradingView affiliate link to receive a 30-day free trial and a discount on your subscription.

tradingview banner

Bullish vs. Bearish Fair Value Gaps

Fair value gaps can either be bullish or bearish, depending on the overall trend and color of the candles. 

Bullish Fair Value Gaps

A bullish fair value gap is identified by a large green candle and states that an asset price recently increased too quickly and may be temporarily overvalued. Therefore, it is likely that the price will eventually come down and fill the fair value gap before continuing higher. 

Bullish Fair Value Gap Example

An excellent example of a bullish FVG can be found on the SPY daily chart on 1/6/2023. Price was steadily consolidating, then a large green candlestick created an FVG, identified by the rectangle on the chart. The bullish FVG is determined by the preceding candles’ high and the following candles’ low. 

bullish fvg example
Bullish FVG Example on TradingView

Bearish Fair Value Gaps

A bearish fair value gap is identified by a large red candle and means that the asset price is temporarily undervalued. Eventually, traders will likely see the price repair this imbalance by increasing and filling the fair value gap. The bearish FVG is determined by the preceding candles’ low and the following candles’ high.

Bearish Fair Value Gap Example

An example of a bearish fair value gap lies on the SPY daily chart on 1/20/2022. The FVG is marked by the purple rectangle, and we also determined the overall trend was down based on the trendline. 

bearish fvg example
Bearish FVG Example on TradingView

Identifying the Overall Trend

The overall trend of an asset is crucial when determining how you will trade the fair value gap. For example, if a stock is in an overall downtrend and you notice a bearish fair value gap, traders will consider shorting when the price fills the FVG. Ideally, the FVG is near a resistance level determined by another indicator or a bearish trendline.

Learning how to conduct technical analysis on your own can be a daunting task and even harder to implement as a trading strategy. However, you can join the HaiKhuu Trading Community to accelerate your learning curve by gaining access to thousands of experienced traders. 

The HaiKhuu Trading Community provides you with live trading calls and daily trading reports to ensure you stay ahead of the curve. 

FVG Trading Strategy – Trading Fair Value Gaps

Now that you understand what a fair value gap is and how to identify one let’s cover a basic FVG trading strategy you can try.

1- Identify a Fair Value Gap

Say for example, you identified the bullish fair value gap we used as an example above on the SPY daily chart. You would draw on your TradingView chart to mark the FVG and proceed to wait for an entry point.

2- Identify the Trend

In our bullish example, we determined that the trend was bullish, identified by our upward trendline. 

3- Determine Entry and Exit Points

To determine an entry point on this bullish fair value gap, you must wait for the gap to fill and proceed to go long once it does. The gap perfectly aligns with our upward trendline, giving it a higher chance to play out. 

4- Risk Management When Using Fair Value Gaps

Nothing is guaranteed in the world of trading, so it would be wise to set a stop loss below the trendline and FVG, in case the strategy doesn’t play out like expected to limit your loss potential.

5- When to Take Profit Using a FVG Strategy

When trading a bullish FVG setup, you can take profit when the asset increases to the next level of resistance or demand zone. Setting a sell order is great, but sometimes, you can miss out on bigger moves.

Alternatively, you can set a stop loss in profit below a support level. You will avoid selling too early by waiting for the asset to break support. However, you may generate less profit than if you attempted to sell at the ‘top’ using resistance levels. 

Related Articles

Doji Candle Types

Bullish Hammer Candlesticks

How to Get Candlesticks on TradingView

Trendspider Coupon Code 25% Off! – FTW25 (2024)

trendspider coupon code

Are you looking for a way to save money on your TrendSpider subscription? If so, you’re in luck.

I have a special TrendSpider coupon code that will give you a 25% discount on any plan.

All you have to do is use click my TrendSpider affiliate link and enter the code FTW25 at checkout when you sign up or upgrade your account.

This is an exclusive offer for my readers, so don’t miss this opportunity to get the best deal on TrendSpider.

How to Get a TrendSpider Discount

TrendSpider is a powerful and innovative platform that helps traders with technical analysis, charting, and automation.

It offers a range of features and tools that can enhance your trading performance and efficiency. However, TrendSpider is not cheap.

Depending on the plan you choose, you can pay up to $199 per month.

That’s why I’m happy to share with you my TrendSpider discount code that will save you 25% on any plan.

To get this discount, all you have to do is follow these simple steps:

  1. Click on this link to go to the TrendSpider website.
  2. Click get started, and choose the plan for prefer.
  3. Fill in your personal details, and when prompted, enter the coupon code FTW25 in the box.
  4. Complete your registration and enjoy your discounted membership!

That’s it. You’ve just secured your TrendSpider discount for life. As long as you keep your subscription active, you’ll pay less than the regular price.

trendspider coupon code

Why Use TrendSpider for Technical Analysis?

TrendSpider is not just another charting platform. It’s a smart and automated system that can help you with technical analysis, market scanning, backtesting, and more. Here are some of the reasons why you should use TrendSpider for your trading:

  • Volume by price: TrendSpider allows you to see the volume distribution at different price levels, which can help you identify support and resistance zones, breakouts, and reversals.
  • Automated analysis: TrendSpider uses algorithms to detect trendlines, patterns, Fibonacci retracements, candlestick formations, and other technical indicators automatically. You can also customize the settings to match your own style and preferences.
  • Real-time data: TrendSpider includes real-time data for stocks, ETFs, forex, crypto, and futures in all plans. You don’t have to pay extra for data feeds or worry about delays or inaccuracies.
  • Dynamic price alerts: TrendSpider lets you set alerts based on various criteria, such as price movements, technical indicators, patterns, or even custom scripts. You can receive notifications via email, SMS, or browser when your conditions are met.
  • Automated trading bots: TrendSpider enables you to create and run trading bots that can execute your trades based on your rules. You can backtest your strategies, optimize your parameters, and monitor your performance.

These are just some of the benefits of using TrendSpider for technical analysis. There are many more features and tools that you can explore and use to improve your trading results.

TrendSpider Discount Code – Bottom Line

TrendSpider is a great platform for any serious trader who wants to take their technical analysis to the next level. It offers a unique combination of automation, intelligence, and customization that can help you find trading opportunities faster and easier.

If you want to get started with TrendSpider today, don’t forget to use my coupon code FTW25 to get a 25% discount on any plan.

Check out my other articles about TrendSpider, such as my full TrendSpider review and my comparison of TrendSpider vs. TradingView.

Related Resources

The Triangle Chart Pattern Explained

trianglechartpattern

Even the most enthusiastic value investors know technical analysis is critical to well-informed investing. Major news outlets often tout momentum investing as outperforming value-based strategies over the past decade. Likewise, financial service firms showcase the impact of these technical trading strategies and factors.

This article focuses on a specific technical analysis, the Triangle Chart Pattern. We’ll explain what it is, its different types, and how to best use it. 

What is a triangle pattern?

A triangle pattern is technical analysis tool that signals what’s known as a continuation pattern: an equity or currency’s price movement within a specific range after the trend falls or rises. The triangle pattern is used to identify whether the next move in the security is a breakout higher or a breakdown in pricing towards aligned with a bearish sentiment.

Traders versed in technical analysis use the triangle chart pattern to identify whether the current price movement of a stock or currency is bearish or bullish after substantial volatility and newfound upside or downside. As the triangle pattern forms, traders pause and analyze the signals to assess what may come next.

After range-bound trading, the price movement will often continue the same pattern. If it is an uptrend, it is known as a breakout. However, that pattern can fail, and the pricing trend can suddenly and viciously reverse. This is known as a pricing breakdown. As such, making trading decisions based on triangle patterns requires a nuanced understanding of the rules and knowledge of the different types of triangle patterns

Understanding Triangle Patterns – What are the rules of triangle patterns?

There are no specific rules for interpreting triangle patterns. Instead, there are general guidelines that traders follow in identifying these patterns. Some of these guidelines include:

  • Triangle patterns are often considered continuation patterns. In this case, triangles are used to identify breakouts for profitable trades. This consideration is especially true for smaller patterns and often presents the best trading opportunities.
  • Conversely, larger patterns in triangles are considered both a continuation trend pattern and an indicator of a reversal trend.
  • Breakout of patterns in either direction is often considered to be confirmed when accompanied by a healthy volume increase. 

Type of Triangles

There are three types of triangle chart patterns. These include:

  • Ascending Triangle – this is a pricing pattern in which the equity is attempting to make multiple attempts at a new high, but none go above a certain threshold. One can draw a straight horizontal upper trendline across the price chart directly above all those highs. Simultaneously, as the price drops back down from that threshold, the low the price reaches is always higher than the last low that was set. One can draw a straight upward-sloping lower trendline across the price chart directly below all those lows.
trianglechartpattern

This pricing momentum indicates increasing confidence among buyers, slowly increasing their bids to place a rising floor on the price.

This confidence-building transpires slowly and then suddenly as buyers detect the rising trend, and all race to buy at once to avoid missing out on the gains. This manifests a massive breakout higher in price as sufficient buyers have stepped in.

  • Descending Triangle – this triangle formation is the inverse of the ascending triangle. In this pricing pattern, the equity or currency makes lower highs at every attempt after an ongoing downward trend before the triangle formation. One can draw a straight downward-sloping trendline across the top of the chart. 
trianglechartpattern

This is usually a result of buyers sensing an opportunity to bid after an ongoing downturn, slowly easing back into the trade. At this triangle formation, the pricing trend is usually unsustainable and often continues back towards the downward trend, breaching the lower trendline.

However, it is essential to note that this isn’t a certainty that this will always happen. There is a breakout strategy to be employed depending on the market dynamics and bullishness. As a result, there may be a case for the trend to reverse and break out higher. So it is always important to pay attention to market conditions overall and the narratives driving those trends.

  • Symmetrical Triangle – this is a unique triangle formation as the top and bottom trendlines converge to the middle towards one another. It is a tug of war between buyers and sellers where the highs are lower than the prior, and the lows are lower than the earlier lows.
trianglechartpattern

Symmetrical triangle patterns can be tricky as traders must carefully review for the potential of a breakout in prices to move higher or a breakdown of prices where the trend turns bearish. As a result, a symmetrical triangle pattern isn’t sufficient to independently guide pricing movement and must be used in tandem with other types of technical analysis

How do you use triangle patterns in trading?

Traders can use several triangle formations as signals to find opportunities for breakouts and forecast future price moves. These include:

  • The trading opportunity in using triangle patterns is identifying breakouts, that is, when the price of a security exits a continuation pattern and pushes through an upper or lower threshold.
  • A breakout higher allows traders to either go long the security or cover their shorts. A breakout lower is an opportunity for traders to open a short position or exit from their long positions.
  • Volumes confirm breakouts. It indicates that whatever is driving the price movement has broad appeal among traders. 
  • Breakouts from symmetrical triangles usually continue the same trend that the security was in before the triangle formed. So, if a stock had been on an upward price trend before entering a consolidation period forming the symmetrical triangle, more often than not, the breakout move would be higher for that stock. 

What is the triangle breakout strategy?

The core aim of the triangle chart pattern is to determine a triangle breakout strategy. Traders gauge various triangles that form to determine the direction of the breakout direction, whether it will be an upper or lower threshold that will be breached from the continuation pattern that the price movement may currently be in.

Below are a few triangle breakout strategies to keep in mind as you use triangle patterns in trading:

  • Breakouts accompanied by increased trading volume signify a firm conviction among traders, and the breakout is most likely to be successful.
  • Conversely, breakouts with low or no volume spikes are likely head fakes and prone to fail. Most breakouts correspond to news or activity around the security, leading to traders jumping into the trade, causing the volume to spike. Absent those spikes in volume connotate, there isn’t sufficient news accompanying the move, thereby unlikely to be sustainable. 
  • It is essential to note that breakouts accompanied by volume spikes can sometimes fail as well, motivated primarily by short-term trading activity to lock in profits early. However, there are sufficient tactical traders in the market to often sustain the breakouts, given the conditions and activity behind the breakout
  • Most often, the successful breakout strategy is built on triangle patterns observed over several months. A sufficient timeframe is required to build out the cacophony among buyers and sellers that eventually results in the breakout.

Conclusion

Everyone has heard the expression, “the trend is your friend.” Technical analysis is essential in finding profitable market opportunities, especially given the strategy’s outperformance for over a decade.

One form of technical analysis often used by traders as a barometer of great trading opportunities is the triangle chart pattern. This is a continuation pattern or a range-bound price movement for a specific time, and triangle chart patterns can be used to identify which direction the price will trend to next.

Ascending, descending, and symmetrical triangles are the different types of triangles that can form, that traders often identify the potential for bearish or bullish outcomes. 

However, the triangle pattern strategy isn’t an all-encompassing panacea, as millions of drivers and narratives can influence pricing action. As such, overall market conditions should be considered, and it is recommended that assessments derived from triangle patterns be used in conjunction with other technical analysis tools. 

Triangle Trading Pattern FAQs

Is the triangle pattern bullish or bearish?

Triangle patterns can be used as both bullish and bearish prognostication. Remembering that a triangle pattern indicates consolidation just before a price breakout is essential. 

An ascending triangle pattern is a bullish signal as it indicates an upward price breakout, showcasing that buyers are gaining momentum. Conversely, a descending triangle pattern signals bearish sentiment, thereby, a lower breakout based on a rising tide of sellers.

What is the success rate of the triangle pattern?

The success rate of the triangle pattern depends on the trader’s skill level. It can be easier to spot buying opportunities in both ascending and descending triangle patterns, usually after resistance is broken. 

However, as good as triangle patterns can be in spotting opportunities, traders must immerse themselves in these patterns’ intricacies and support market conditions to trade on them successfully.

What are the different types of triangles in Forex?

The same type of triangles chart patterns form in Forex as with stocks; ascending, descending, and symmetrical triangles. However, where fundamentals and overall market conditions can impact stocks when reviewing their triangles, it is vital to consider forex chart readings in context to larger narratives regarding countries’ economics and geopolitical situations, given the outsized influence these matters fundamentally exert on currency markets. 

What is a triangle pattern in stocks?

A triangle pattern in stocks is a continuation pattern in which the stock price remains range-bound for a specific time. The culminating chart of that stock price form a triangle based on straight lines drawn across the stock price’s upper and lower trends. These triangles form ascending, descending, and symmetrical triangles. Each of these triangle patterns can be used to ascertain the future direction of the stock, whether it’s a higher or lower price breakout.

The 7 Best Technical Analysis Books to Improve Your Trading

best technical analysis books

Technical analysis is the study of price movements and patterns in financial markets, using charts and indicators to identify trends, signals, and opportunities.

In this article, we will review the 7 best technical analysis books that every trader should read.

best technical analysis books

Whether you are a beginner or a seasoned trader, these books will help you improve your trading performance and achieve your financial goals.

Additionally, we recommend TradingView for technical analysis, as it is the best charting software for all markets.

The 7 Best Technical Analysis Books

1- Getting Started in Technical Analysis

2- How to Make Money in Stocks: A Winning System in Good Times and Bad

3- Japanese Candlestick Charting Techniques

4- Encyclopedia of Chart Patterns

5- Technical Analysis Using Multiple Timeframes

6- Technical Analysis For Dummies

7- Technical Analysis of Stock Trends

Getting Started in Technical Analysis

Getting Started in Technical Analysis is a great introduction to technical analysis for beginners. It explains the basic concepts and techniques of technical analysis in a clear and simple way. It covers topics such as trends, trading ranges, chart patterns, and more. Getting Started in Technical Analysis also provides in-depth coverage of:

  • Trading systems-trend-following, counter-trend, pattern recognition.
  • Software for charting and analysis.
  • The challenges of trading illiquid and thinly traded markets.
  • How to avoid false signals and whipsaws.
  • Risk control strategies.
  • The psychological aspects of trading discipline, commitment, confidence, and more.

Getting Started in Technical Analysis is a comprehensive and practical guide to the art and science of technical analysis. It is suitable for anyone who wants to learn how to use charts and indicators to make better trading decisions.

How to Make Money in Stocks: A Winning System in Good Times and Bad

How to Make Money in Stocks: A Winning System in Good Times and Bad is a national bestseller that has taught over 2 million investors how to build wealth through the stock market. It is based on a major study of market winners from 1880 to 2009.

How to Make Money in Stocks is not just a book about technical analysis. It is also a book about fundamental analysis, market psychology, portfolio management, and trading philosophy. It teaches you how to use O’Neil’s famous CAN SLIM system to identify and buy the best growth stocks in any market condition.

How to Make Money in Stocks is a must-read for anyone who wants to learn how to beat the market consistently and achieve financial freedom.

Japanese Candlestick Charting Techniques

Japanese Candlestick Charting Techniques is the most comprehensive and trusted guide to this essential technique. It is written by a pioneer trader who has done years of research on candlestick charting. It covers everything you need to know, including hundreds of examples that show how candlestick techniques can be used in all of today’s markets.

Japanese Candlestick Charting Techniques will teach you how to:

  • Recognize and interpret the most common candlestick patterns
  • Combine candlestick analysis with other technical tools such as moving averages, trendlines, support and resistance levels
  • Apply candlestick techniques to various time frames and markets such as stocks, forex, futures
  • Use candlestick signals to identify trading opportunities and manage risk
  • Enhance your trading performance with advanced candlestick concepts such as continuation patterns, reversal patterns, gaps, windows, harami, doji, shooting star, hammer, morning star, evening star, dark cloud cover, piercing line, engulfing pattern, and more.

Japanese Candlestick Charting Techniques is a classic book that every technical analyst should have in their library. It is not only a reference book but also a trading manual that will help you master one of the most powerful and effective methods of chart analysis.

Encyclopedia of Chart Patterns

Encyclopedia of Chart Patterns updates the classic with new performance statistics for both bull and bear markets and 23 new patterns, including a second section devoted to ten event patterns.

The author tells you how to trade significant events, such as quarterly earnings announcements, retail sales, stock upgrades and downgrades, and more!

Encyclopedia of Chart Patterns will show you how to:

  • Identify and profit from the most reliable chart patterns
  • Use pattern recognition to filter out noise and focus on the most important price movements
  • Measure the strength and reliability of each pattern with performance rankings and failure rates
  • Optimize your entry and exit points with precise trading rules and guidelines
  • Avoid common mistakes and pitfalls that can ruin your trades

Encyclopedia of Chart Patterns is a comprehensive and authoritative reference book that covers over 100 chart patterns, including classic patterns, event patterns, rare patterns, and failed patterns. It is an invaluable resource for any technical trader who wants to improve their pattern recognition skills and increase their trading success.

Technical Analysis Using Multiple Timeframes

Technical Analysis Using Multiple Timeframes is written by a trader and author for traders. It provides real-world examples of price action. It is considered a short textbook that offers practical knowledge. The author developed a method called Squeeze Dynamics Theory, which uses technical analysis and multiple timeframes.

Technical analysis using multiple timeframes involves analyzing stock price charts in different time frames. Higher time frames can help identify trends, while lower time frames can help identify entry and exit points.

Technical Analysis Using Multiple Timeframes will help you:

  • Understand the principles of technical analysis and how to apply them to any market
  • Learn how to use multiple timeframes to identify the best trading opportunities
  • How to develop your own trading plan
  • Trade with confidence and discipline using clear and objective rules
  • Avoid emotional mistakes and overcome psychological barriers

Technical Analysis Using Multiple Timeframes is a book that will change the way you look at the markets. It will teach you how to combine different perspectives and tools to create a holistic and profitable trading approach.

Technical Analysis For Dummies

Technical Analysis For Dummies helps you take a realistic look at what securities prices are actually doing rather than what economists or analysts say they should be doing.

The book teaches you how to:

  • Determine how markets are performing and make decisions using real data
  • Spot investment trends and turning points
  • Improve your profits and your portfolio performance

Technical Analysis For Dummies is a friendly and easy-to-understand guide that introduces you to the basic concepts and techniques of technical analysis. It covers topics such as:

  • Chart types, patterns, indicators, oscillators, and signals
  • Trend analysis, trendlines, channels, support and resistance levels
  • Trading systems, strategies, styles, and tactics
  • Risk management, money management, position sizing, and stop-loss orders
  • Technical analysis tools, software, platforms, and resources

Technical Analysis For Dummies is a book that will help you get started with technical analysis in a fun and simple way. It will also help you avoid common pitfalls and misconceptions that can hinder your trading success.

Technical Analysis of Stock Trends

Technical Analysis of Stock Trends is widely considered to be one of the seminal works of the discipline. It was published in 1948 and is exclusively concerned with trend analysis and chart patterns.

It remains in use to the present. It is clear that chart analysis was the main method of technical analysis in the early days because computers did not have enough processing power for statistical analysis.

Technical Analysis of Stock Trends will teach you how to:

  • Identify the major trends of the market using the Dow Theory
  • Analyze price movements using bar charts, point-and-figure charts, line charts, candlestick charts
  • Recognize and trade various chart patterns such as triangles, rectangles, head-and-shoulders, double tops, double bottoms, wedges, flags, pennants, and more.
  • Use volume, breadth, sentiment, moving averages, trendlines, support and resistance levels to confirm or refute chart signals
  • Apply technical analysis to different time frames, markets, sectors, industries, and stocks

Technical Analysis of Stock Trends is a book that every serious technical analyst should read. It is a classic book that has stood the test of time and has influenced generations of traders. It is a book that will help you understand the logic and psychology behind price movements and chart patterns.

The Best Technical Analysis Tools

Technical analysis is not only about reading books and learning theories. It is also about using the right tools to apply your knowledge and skills to the real markets.

There are many technical analysis tools available in the market, but not all of them are created equal.

TradingView is a web-based platform that allows you to use hundreds of indicators and draw patterns on your chart. TradingView supports stocks, forex, futures, cryptocurrencies, and more.

It also has a powerful backtesting and paper trading feature that lets you test your trading system before risking real money.

TradingView is completely free to use, but if you want to access more features and benefits, you can upgrade to a premium plan.

If you are serious about trading, you can test out the premium features by using our link to sign up for a free trial. You will also get a discount on your subscription if you sign up using our link.

TradingView is the best technical analysis tool that we have ever used. It is easy to use, reliable, and versatile. It can help you improve your trading skills and results in any market. We highly recommend it to anyone who wants to take their trading to the next level.

Related Articles

Anchored VWAP

Disclosure: This post contains affiliate links from Amazon and TradingView. As an Amazon Associate, I earn from qualifying purchases. This means that if you click on these links and make a purchase, I will receive a small commission at no extra cost to you.

MA vs. EMA vs. SMA vs. WMA – Moving Average Indicators

emavssmavswma

Moving averages are fundamental tools used by traders and analysts in financial markets to understand and predict price trends.

This article explains the primary types of moving averages: Simple Moving Averages (SMA), Exponential Moving Averages (EMA), and Weighted Moving Averages (WMA), highlighting their differences and practical applications.

emavssmavswma

What is a Moving Average (MA)

A Moving Average (MA) is a statistical tool used to analyze data points by creating a series of averages from different subsets of the complete dataset.

SMAs, EMAs, and WMAs are types of MAs.

The MA smooths out price data on a chart to create a single flowing line, making it easier to identify the direction of the trend.

MA vs. EMA Compared

When comparing MA and EMA, the primary difference lies in sensitivity. The EMA is more sensitive to recent price changes than the MA, which can lead to early signals for entering or exiting trades.

SMA vs. EMA Compared

SMA and EMA are both types of moving averages but differ in their calculation. The SMA assigns equal weight to all values, while the EMA gives more weight to recent data, offering a quicker response to price changes.

SMA vs. MA Compared

The SMA is a type of MA with a specific method of calculation – it calculates the average price over a set period without weighting. In contrast, other MAs, like the EMA and WMA, apply different weightings.

WMA vs. EMA Compared

Both WMA and EMA give more importance to recent data but differ in their approach. The WMA uses a linear weighting method, while the EMA uses an exponential approach, making the EMA quicker to react to recent price movements.

What is the Simple Moving Average (SMA)

The Simple Moving Average (SMA) is the most basic form of the moving average. It is calculated by taking the arithmetic mean of a given set of prices over a specified period.

The SMA gives equal weight to each price point within the period. The SMA is most commonly used by swing traders and investors with longer timeframe trades and investments.

smatradingview
SMA on TradingView

Common Lengths for SMAs

The most common SMAs utilized are the 50 and 200-day simple moving averages, also known as the 50 and 200-day moving averages.

You can access these on TradingView by adding ‘Moving Average Simple’ twice to your indicators. Then, you must set the length of one to 50 and the other to 200 and use the daily timeframe.

When the 50-day SMA crosses above the 200-day SMA, this is called a golden cross.

What is the Exponential Moving Average (EMA)

The Exponential Moving Average (EMA) is a type of moving average that places a greater weight and significance on the most recent data points.

Unlike the SMA, it reacts more quickly to price changes, making it a preferred choice for traders looking for sensitivity to recent price movements, such as day traders.

ematradingview
EMA on TradingView

Common Lengths for EMAs

Common lengths for EMAs include 9,12, and 26.

You can access EMAs on TradingView by adding the ‘Moving Average Exponential’ to your chart. You can check out my full article about adding moving averages to TradingView for more information.

You can then adjust the length in the indicator settings to whichever you prefer. Generally, when a short-term EMA like the 9-EMA crosses over a longer one like the 26-EMA, this is considered a bullish crossover.

What is the Weighted Moving Average (WMA)

The Weighted Moving Average (WMA) assigns a heavier weighting to more recent data points. The weightage decreases linearly for older prices, making it similar to the EMA but with a different method of calculation and emphasis.

The WMA is much less popular than the SMA and EMA indicators. Additionally, if you’d like to save your moving average settings on TradingView, you can consult my article about saving your chart layouts on TradingView.

wmatradingview
WMA on TradingView

How to Use Moving Averages to Trade Effectively

Moving averages are pivotal in trading strategies. They can indicate potential buy or sell signals and help in identifying support and resistance levels.

Traders often use two moving averages together for a crossover strategy, where the crossing of a shorter period MA over a longer period MA indicates a potential trend reversal.

The Best Lengths for Moving Averages

The best length for a moving average depends on the trader’s objectives and the market’s volatility.

Short-term traders might prefer shorter periods, like 5 or 10 days, for more sensitivity, while long-term investors might opt for 50 or 200 days to filter out market noise.

Additionally, long-term traders may prefer SMAs, while short-term traders may prefer EMAs since they use more recent price data.

Which Moving Average is Best for Day Trading?

For day trading, where quick decisions are crucial, shorter-period MAs like the 5 or 10-day EMA or WMA are typically preferred due to their responsiveness to recent price changes.

The most common moving average for day trading is the combination of the 9-EMA with the 26-EMA.

MA vs. EMA vs. SMA vs. WMA – Bottom Line

Each moving average – MA, EMA, SMA, and WMA – has its unique features and applications. Which you should use depends on your strategy, the time frame of trading, and the specific market conditions.

Understanding these differences is key to employing these tools effectively in trading scenarios.

If you’d like to get better at technical analysis, you should create a free TradingView account to analyze all markets within a single platform.

If you sign up for TradingView using my link, you will also get a discount on your subscription if you choose to upgrade to a premium plan.

Disclaimer: Financial Tech Wiz is a TradingView affiliate and will be compensated if you use our link to purchase a TradingView subscription.

11 Best TradingView Indicators in 2024

besttradingviewindicatorsfeatured

Are you overwhelmed with the massive amount of TradingView indicators to choose from? Figuring out which ones work best takes time, so I compiled a list of the top indicators to improve your trading in this article. All of the indicators on this list are native to TradingView, and do not require you to pay a third-party. They are also all indicators I have used personally over my years of trading.

What are the Best Indicators on TradingView?

There are tons of indicators on TradingView. However, the best ones include:

  • Volume Profile – view volume by price instead of by time
  • Ichimoku Clouds – quick “one look” indicator to identify entries and exits
  • Auto Fib Retracement – draws Fibonacci retracements automatically
  • Market Profile – view how much time is spent at various price levels
  • VWAP – a smooth line showing you the average trading price for one day weighted by volume
  • MACD – moving average convergence divergence determines momentum
  • Moving Averages – view EMA and SMA lines such as the 50 and 200-day moving average lines
  • Relative Strength Index (RSI) – quick way to tell if a stock is overvalued or undervalued on a scale of 0-100
  • Anchored VWAP – VWAP anchored to a specific date
  • IV Rank and Percentile – detrmines whether a stock’s implied volatility is high or low
  • Footprint Charts – view filled order volume by price for each candle

Clicking the links above will bring you to the detailed descriptions of the indicators within this article.

  • The best TradingView indicators to use are the volume profile, anchored VWAP, Ichimoku, and Fibonacci retracements.
  • Continue reading to view the 11 best TradingView indicators and how you can use them to improve your trading strategy.

1- Volume Profile Indicator

The volume profile shows you volume by price for a defined time period. Traditional volume charts show you volume by time, which is not nearly as valuable. Traders can determine what price has the most supply and demand, which is extremely helpful in determining support and resistance levels on a chart. 

TradingView offers a few different types of volume profile indicators:

  • Visible Range Volume Profile: view the profile for the visible candles on the chart, which adjusts dynamically as you zoom in and out.
  • Session Volume Profile: view a unique profile that resets each trading day (session), which is great for day traders.
  • Volume Profile Fixed Range: pick a range of candles to view a volume profile for that doesn’t change as you move around your charts.

My favorite way to use the volume profile indicators on TradingView is to combine the session volume profile with the visible range volume profile so you can view profiles for each day and the entire visible chart.

The volume profile indicator on TradingView is an advanced tool that requires you to have a premium subscription. However, new users can usually get a TradingView free trial to test it out for 30 days.

Full Indicator Review: Learn more about the volume profile

tradingview volume profile indicator

TradingView Limited Time Offer!

Exclusive Deal: 30-Day FREE Premium Access + Bonus Credit

Don’t Miss Out – Sign up for TradingView Now!

  • Advanced Charts
  • Real-Time Data
  • Track all Markets
CLAIM YOUR FREE TRIAL

2- Ichimoku Clouds

The Ichimoku Cloud is a dynamic trend following indicator involving several moving average lines. It consists of five lines and a “cloud” formed by the interaction of two of these lines.

A green cloud signals an uptrend, while a red cloud signals a downtrend.

Additionally, you can use the baseline and conversion line crossovers to determine entry and exit points.

The baseline and conversion lines are similar to a 9EMA and a 26EMA, another common indicator traders use.

The Ichimoku Cloud allows you to identify trends easily and determine entry and exit points based on TK crossovers.

ichimoku cloud

3- Auto Fib Retracement

The Auto Fib Retracement indicator automatically plots Fibonacci retracement levels on a chart, helping traders identify potential support and resistance zones based on the key Fibonacci ratios (23.6%, 38.2%, 50%, 61.8%, and 78.6%).

While traders often draw their own Fib Retracement lines manually, the Auto Fib tool is a great way to save time and view retracement levels on several time frames.

You can also change the depth to a larger number if the indicator is drawing the lines too close to the current stock price.

Auto fib retracement tools are also available on Trendspider. To learn more, check out my article on TrendSpider vs. TradingView!

auto fibonacci retracement indicator on tradingview

Full Indicator Review: Learn more about the Fibonacci retracements on TradingView

4- Market Profile (Time Price Opportunity TPO Charts)

The market profile is similar to the volume profile, except it also shows time spent at prices on top of volume by price. The market profile is commonly used by futures traders to interpret the market structure and identify trading opportunities.

I recommend you learn to identify market structures like poor highs, poor lows, single prints, and understand the mechanics of auction market theory to make the best use of the TPO charts. TradingView’s TPO charts aren’t available to free users, but you can use my affiliate link to get a free trial to test it out for 30 days with no commitment.

Full Indicator Review: Learn more about the TradingView TPO charts

an image of TPOs and volume profile on TradingView

5- VWAP (Volume Weighted Average Price)

The VWAP is a TradingView indicator for day traders that shows you where the most volume has occurred through a particular trading day. It is considered about the fair price for a stock since it is where the most shares have been traded.

VWAP strategies include buying when the price breaks over the VWAP for a continuation play. Alternatively, you can wait for the stock price to be far away from the VWAP and use a mean reversion strategy. You can also check out the anchored VWAP if you are not a day trader.

Full Indicator Review: Learn more about the VWAP on TradingView

tradingview vwap indicator

6- Moving Averages

There are two types of moving averages, SMA (simple moving average) and EMA (exponential moving average). The most common ones for swing traders and investors to utilize are the 50 and 200 SMA lines on the daily chart. Otherwise known as the 50 and 200-day moving averages.

Short-term traders use EMA lines such as the 9 and 26-period lines on shorter-term time frames like the 5-minute and 1-minute charts for day trading and short-term swing trading.

Full Indicator Review: Learn more about TradingView moving averages

tradingview moving average lines

7- MACD

The MACD (Moving Average Convergence Divergence) is a popular trend-following indicator. It is the result of two lines: the MACD line and the signal line. 

  • MACD Line: The MACD line is the result of subtracting the 26-period EMA by the 12-period EMA, typically for days when used on the daily timeframe. 
  • Signal Line: The signal line is the 9-period EMA of the MACD line.

When the MACD line crosses above the signal line, it’s considered a bullish signal (suggesting it might be a good time to buy). Conversely, when the MACD line crosses below the signal line, it’s viewed as a bearish signal (suggesting it might be a good time to sell).

macd on tradingview

Full Indicator Review: Watch our video on the TradingView MACD

8- Relative Strength Index (RSI)

The RSI indicator is a popular tool for identifying whether an asset is overbought or oversold. It is a momentum oscillator that measures the speed and change of price movements on a scale from 0 to 100. 

Typically, a stock with an RSI reading over 70 is considered overvalued, while a reading under 30 is considered undervalued. However, it is best to combine the RSI with other indicators to determine optimal entry and exit points.

The RSI is calculated based on an asset’s price movements over a certain period, typically 14 days. It compares the magnitude of recent gains to recent losses to determine the speed and change of price movements.

Full Indicator Review: Learn more about the TradingView RSI

RSI on tradingview

9- Anchored VWAP

The Anchored VWAP (Volume Weighted Average Price) is a trading indicator that gives traders a comprehensive look at a stock’s price in relation to its volume over a specific time frame.

Generally, traders will set the anchor point at a swing high or a swing low. For example, if a stock made a 52-week low a few weeks back, you can set the anchored VWAP here to determine a good medium term support level.

The regular VWAP is the average price of a stock weighted by its volume. The unique feature of the Anchored VWAP is that it allows traders to choose a specific starting point (or “anchor”) from which to calculate the VWAP.

Full Indicator Review: Learn more about the anchored VWAP

anchored vwap on tradingview

10- Implied Volatility Rank and Percentile

Implied volatility represents how much volatility the market is pricing for a specific asset. When implied volatility is high, options are generally more expensive to account for the perception of large price movements in the future. It is a key factor in options pricing and trading strategies.

Implied volatility rank and percentile help you determine whether a stock’s implied volatility is high or low based on the last year of data. Implied volatility rank is free to use on TradingView but is not native to the platform. You can use the IV Rank and Percentile custom indicator by Martin Shkreli for free. 

Full Indicator Review: Learn more about IV Rank & Percentile on TradingView

iv rank and percentile on tradingview

11- Volume Footprint Charts

TradingView’s volume footprint chart type allows you to view how many orders have been filled on both the buy and sell side.

On the left side of the candle, you can see how many shares were sold by price in red. On the right side of the candle, you can see how many shares were bought within that candle and at what price.

The bottom of the candle also shows you the delta and total volume traded during the candle you are analyzing. The volume footprint feature requires you to have a TradingView paid subscription, but you can use my affiliate link to get a free trial to test it out for free.

Full Indicator Review: Learn more about the TradingView footprint charts

tradingview footprint chart

How to get a TradingView free trial

If you don’t want to spend your hard-earned money testing out some of these indicators, new users can usually get a 30-day TradingView free trial.

TradingView is one of the most widely used charting tools available, and it is great for beginners and advanced traders. We have an entire article explaining how to get a TradingView free trial you can read if you have any questions.

TradingView Limited Time Offer!

Exclusive Deal: 30-Day FREE Premium Access + Bonus Credit

Don’t Miss Out – Sign up for TradingView Now!

  • Advanced Charts
  • Real-Time Data
  • Track all Markets
CLAIM YOUR FREE TRIAL

Which indicator is best for entry and exit?

There isn’t a single indicator that is “best” for determining entry and exit points. However, the Ichimoku indicator provides traders clear signals when the baseline and conversion lines crossover.

When the conversion line cross above the baseline, it is a signal to buy. On the other hand, when the baseline crosses below the baseline, it is a signal to sell.

Once you are in a position, you can use one of the several lines to determine your stop loss and take profit levels.

What indicator do most traders use?

There are tons of indicators to use on Tradingview, and each trader must find the one that works best for their trading strategy.

However, the most common indicators include Fibonacci Retracements, simple moving averages (SMAs), and exponential moving averages (EMAs).

The Best TradingView Indicators | Bottom Line

Selecting and utilizing the appropriate indicators is crucial for successful trading. The right indicators can provide valuable information on market trends, support and resistance levels, and potential trade opportunities.

By understanding how each indicator works and using them in conjunction with other technical analysis tools, traders can enhance their market analysis skills and improve their overall trading performance. Check out our article on the best TradingView indicators for day trading to learn more!

FAQs

What are TradingView indicators?

  • TradingView indicators are tools or mathematical calculations applied to price data on the TradingView platform.

How do I access indicators on TradingView?

  • To access indicators on TradingView, simply open the platform and select the “Indicators” button located at the top of the charting window. This will open a menu where you can search for and select various indicators based on your trading needs.

Are the best TradingView indicators free?

  • TradingView offers a wide range of both free and paid indicators. While there are many excellent free indicators available, some more advanced or specialized indicators like the volume profile that may require a paid subscription or purchase. However, there are plenty of powerful indicators that can be utilized at no cost. You can learn more in our TradingView pricing article.

How can I determine the best TradingView indicators for my trading strategy?

  • Selecting the best TradingView indicators for your trading strategy depends on your individual preferences, trading style, and goals. It’s essential to consider factors such as your preferred timeframes, market conditions, and the specific insights you need from indicators. Experimenting with different indicators and analyzing their performance in relation to your strategy can help you determine which ones work best for you.

Can I create custom indicators on TradingView?

  • Yes, TradingView provides a feature called Pine Script that allows users to create their own custom indicators. Pine Script is a domain-specific scripting language designed for creating and modifying indicators and strategies on the TradingView platform. It offers a flexible and powerful framework for traders who want to develop their own unique indicators.

How can I install and use custom indicators on TradingView?

  • To install and use custom indicators on TradingView, follow these steps:
  • Write or obtain the Pine Script code for the custom indicator.
  • Open TradingView and go to the chart where you want to apply the custom indicator.
  • Click on the “Indicators” button and select “Invite-Only Scripts” or “Pine Editor” depending on your TradingView subscription plan.
  • Open the Pine Editor and paste the custom indicator’s code into the editor.
  • Click “Add to Chart” to apply the custom indicator to your chart.

Before you go

If you want to keep educating yourself about TradingView, you must check out these posts as well:

The 6 Best Indicators for Day Trading

best indicators for day trading

Day trading is a style of trading that involves opening and closing positions within the same day, taking advantage of small price movements in the market.

In this article, we will discuss some of the best indicators for day trading, how they work, and how to use them on the best charting platform available.

The Best Charting Platform With Integrated Indicators

One of the most important tools for day trading is a reliable and powerful charting platform that allows you to access real-time data, customize your charts, and apply various indicators to analyze the market. There are many charting platforms available online, but one of the best ones is TradingView.

TradingView is a web-based platform that supports all markets, including stocks, forex, futures, cryptocurrencies, and more. It offers advanced features such as multiple chart types, drawing tools, alerts, backtesting, and more. You can read my article on the best TradingView indicators for day trading to learn more.

TradingView is free to use, but you can also upgrade to a premium plan to access more features and indicators. If you use our link to sign up, you will get a discount and a free trial of TradingView’s premium features and indicators.

The Best Indicators for Day Trading

There are hundreds of indicators that you can use for day trading, but not all of them are equally useful or effective. Some of the best indicators for day trading include the volume profile, auto fib retracements, simple moving averages, exponential moving averages, the Ichimoku clouds, and the VWAP.

Auto Fibonacci Retracements

Fibonacci retracements are a popular tool among traders that use the Fibonacci sequence to identify potential support and resistance levels in the market. The Fibonacci sequence is a series of numbers that starts with 0 and 1, and each subsequent number is the sum of the previous two numbers (e.g., 0, 1, 1, 2, 3, 5, 8…).

The Fibonacci ratios are derived from dividing one number in the sequence by another number that is one or more places to the right (e.g., 1/2 = 0.50, 3/8 = 0.38, 5/13 = 0.38…). The most common Fibonacci ratios used by traders are 23.6%, 38.2%, 50%, 61.8%, and 78.6%.

best indicators for day trading fibonacci

The normal way to draw Fibonacci retracements is to identify a significant high and low point in the price movement (also known as swing points) and connect them with the Fibonacci drawing tool.

However, drawing Fibonacci retracements manually can be tedious and time-consuming, especially for day traders who need to constantly update them as the market changes. That’s why using an auto Fibonacci retracement indicator is extremely useful for day traders. Check out our complete article on Fibonacci retracements for more information.

Volume Profile

Volume profile is another useful indicator for day trading that shows you how much volume was traded at each price level over a given period of time. It helps you understand where supply and demand zones are in the market and how they affect the price movement.

The main parts of the volume profile indicator are the volume point of control (VPOC), the high volume node (HVN), and the low volume node (LVN). The VPOC is the price level where the most volume was traded, indicating a balance between buyers and sellers.

best indicators for day trading volume profile

The HVN is a price level where a lot of volume was traded, indicating a strong interest or activity in the market. The LVN is a price level where little volume was traded, indicating a lack of interest or activity in the market.

The volume profile indicator can help you identify potential support and resistance levels based on the volume distribution. For example, when the price is above an HVN, it acts as support. When the price is below an HVN, it acts as resistance. When the price moves from an LVN to an HVN or vice versa, it indicates a breakout or a reversal.

There are different types of volume profiles that you can use for day trading, depending on your time frame and preference. The most common ones are the session volume profile and the visible range volume profile.

The session volume profile shows you the volume profile for each trading day, while the visible range volume profile shows you the volume profile for everything visible on the chart.

The best way to use the volume profile indicator for day trading is with TradingView, as it offers a built-in volume profile tool that you can easily customize and apply to any market.

For more information on how to use the volume profile indicator on TradingView, you can check out our article on TradingView Volume Profile.

Ichimoku Cloud

The Ichimoku cloud is an all-in-one indicator that provides entry and exit signals, support and resistance levels, and trend identification. It consists of five lines that form a cloud-like shape on the chart:

best indicators for day trading ichimoku
  • The conversion line (Tenkan-sen) is the average of the highest high and the lowest low in the last nine periods.
  • The base line (Kijun-sen) is the average of the highest high and the lowest low in the last 26 periods.
  • The leading span A (Senkou span A) is the average of the conversion line and the base line, plotted 26 periods ahead.
  • The leading span B (Senkou span B) is the average of the highest high and the lowest low in the last 52 periods, plotted 26 periods ahead.
  • The lagging span (Chikou span) is the current closing price, plotted 26 periods behind.

The Ichimoku cloud indicator can help you identify trading opportunities based on various signals and rules. For example:

  • When the conversion line crosses over the base line, it is a buy signal. When it crosses under the base line, it is a sell signal.
  • When the price is above the cloud, it indicates an uptrend. When it is below the cloud, it indicates a downtrend. When it is inside the cloud, it indicates a consolidation or a transition.
  • When the cloud changes color from red to green or vice versa, it indicates a potential trend reversal or continuation.

The Ichimoku cloud indicator works well for day trading because it adapts to different time frames and market conditions. You can use it to scalp, swing, or trend trade, depending on your preference and strategy.

The most common time frames for day trading with Ichimoku are the 1-minute chart for scalping and the 5-minute chart for day trades.

To learn more about how to use Ichimoku cloud for day trading, you can check out this Ichimoku Cloud Thinkorswim Guide.

Volume Weighted Average Price – VWAP

The volume weighted average price (VWAP) is an indicator that shows where “fair value” is for a stock on a particular day. It is calculated by multiplying each trade price by its volume and then dividing by the total volume traded on that day. It creates a single line that moves along with the price action.

best indicators for day trading VWAP

The VWAP indicator can help you identify potential support and resistance levels based on where the price is relative to the VWAP line. For example:

  • When the price is above the VWAP line, it indicates that buyers are in control and that sellers may be willing to sell at lower prices.
  • When the price is below the VWAP line, it indicates that sellers are in control and that buyers may be willing to buy at higher prices.
  • When the price crosses over or under the VWAP line, it indicates a change in momentum or sentiment.

The VWAP indicator is especially useful for day trading because it reflects how much value was traded at each price level on that day. It helps you avoid buying too high or selling too low by showing you where most traders are trading. There is also the anchored VWAP indicator, which is similar but can be used on all timeframes.

Simple Moving Averages – SMA

Simple moving averages (SMA) are indicators that show the average price of a stock over a certain period of time. They help you identify the direction and strength of the trend, as well as potential support and resistance levels.

The most common SMA lines are the 50 and 200-day moving averages (i.e., the 50 and 200 SMA lines on a daily timeframe chart). These lines indicate the long-term trend of the market and are often used by investors and traders to make trading decisions

best indicators for day trading SMA lines

However, for day trading, you may want to use shorter time frames and periods for your SMA lines, as they will be more responsive to the price action and provide more signals.

For example, you can use the 1 or 5-minute time frame and apply the 50 and 200 SMA lines to your chart. These lines will act as support and resistance levels for day trading, as the price will tend to bounce or break from them.

To learn more about how to use simple moving averages for day trading, you can check out our article on TradingView moving averages.

Exponential Moving Averages – EMA

Exponential moving averages (EMA) are similar to simple moving averages, but they give more weight to the recent prices than the older ones. This makes them faster and more sensitive to the price action, which can be useful for day trading.

Exponential moving averages can also act as support and resistance levels for day trading, depending on where the price is relative to them.

best indicators for day trading EMA

For example, you can use the 9 and 26-period EMAs, which are commonly used on the 1 and 5-minute time frame by day traders. These EMAs can help you identify entry and exit points based on their crossover or divergence.

For example:

  • When the 9 EMA crosses over the 26 EMA, it indicates a bullish signal. You can buy when the price is above both EMAs and sell when it crosses below them.
  • When the 9 EMA crosses under the 26 EMA, it indicates a bearish signal. You can sell when the price is below both EMAs and buy when it crosses above them.
  • When the 9 EMA diverges from the 26 EMA, it indicates a strong trend. You can follow the trend until it converges again.
  • When the 9 EMA converges with the 26 EMA, it indicates a weak trend or a consolidation. You can wait for a breakout or a reversal.

To learn more about how to use exponential moving averages for day trading, you can check out our article on TradingView moving averages.

The Best Charting Platform for Using Day Trading Indicators

As we have seen, there are many indicators that you can use for day trading, but not all of them are available or compatible with every charting platform. That’s why we recommend using TradingView as your main charting platform for day trading, as it offers many advantages over other platforms.

TradingView is a web-based platform that supports all markets and every indicator you can imagine with real-time data. It also allows you to customize your charts, create your own indicators, and backtest your strategies. It has a user-friendly interface and a responsive design that works on any device.

TradingView is free to use, but you can also upgrade to a premium plan to access more features and indicators. If you use our link to sign up, you will get a discount and a free trial of TradingView’s premium features and indicators.

We hope this article has helped you learn about some of the best day trading indicators and how to use them on TradingView. Remember that indicators are only tools that can help you analyze the market and make trading decisions, but they are not infallible or magic.

You still need to have a solid trading plan, risk management, discipline, and patience to succeed in day trading. You can also check out our article on the best TradingView indicators for more information.