TradingView Footprint Charts Explained
Footprint charts aren’t commonly offered on popular trading platforms, but TradingView now offers the ability to access them as a native feature. Footprint charts allow you to visualize buying and selling volume data for every candle, which pairs great with the new TradingView market profile. Continue reading to learn how to use the volume footprint charts on TradingVIew.
Key Takeaways of TradingView Footprint Charts
- TradingView now offers native footprint charts as a premium feature, allowing users to visualize buying and selling volume data for every candle.
- You can access the footprint chart on TradingView by selecting “Volume footprint” from the chart type options.
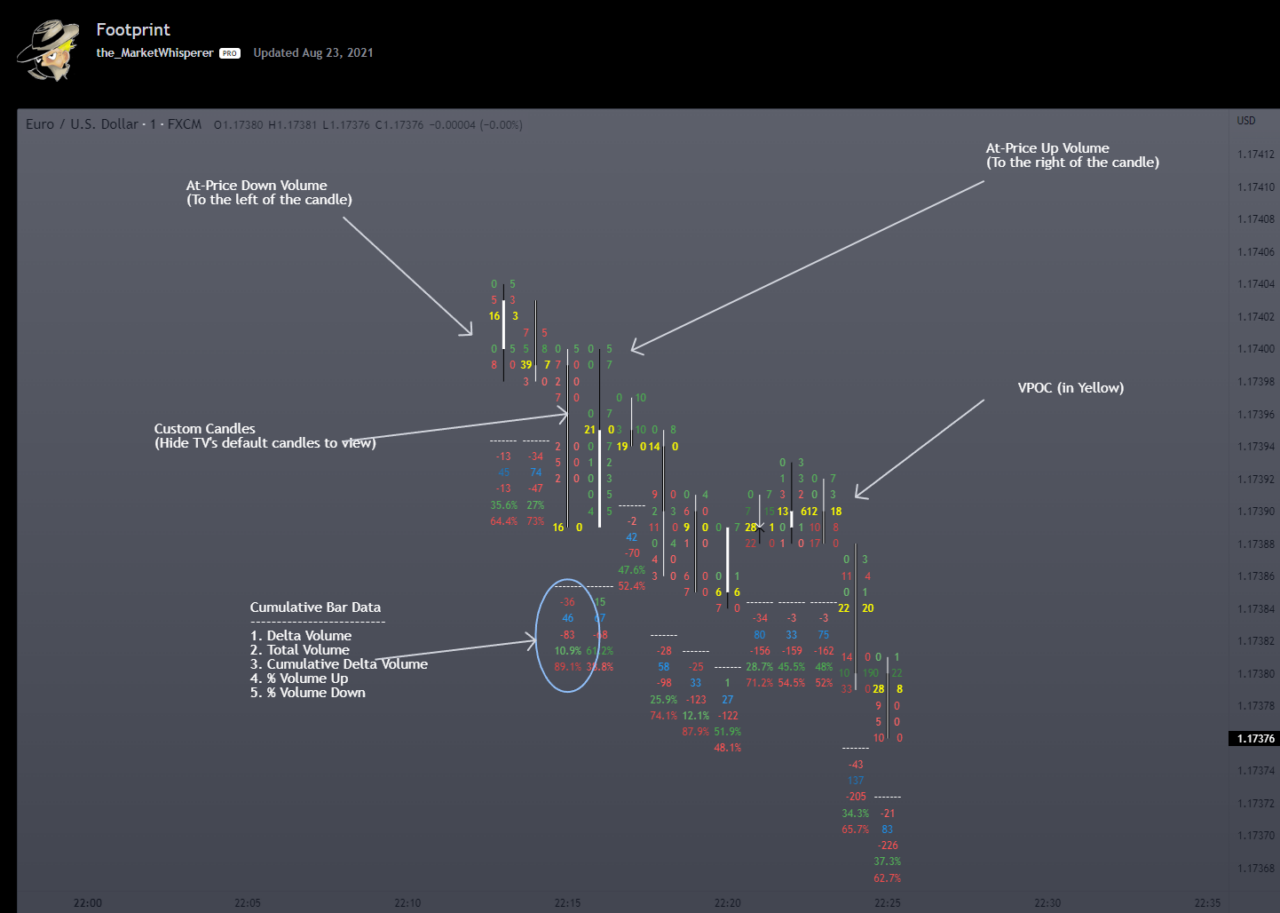
- The footprint charts display sell orders in red on the left side of each candle and buy orders in green on the right side.
Exclusive Deal: 30-Day FREE Premium Access + Bonus Credit
Try TradingView’s Footprint Charts with No Cost – Start Your Free Trial Now!
- Access Footprint Charts
- Advanced Market Profile Tools
- Real-Time Data & Volume Analysis
How to Access Footprint Charts on TradingVIew
To access TradingView footprint charts, follow these steps:
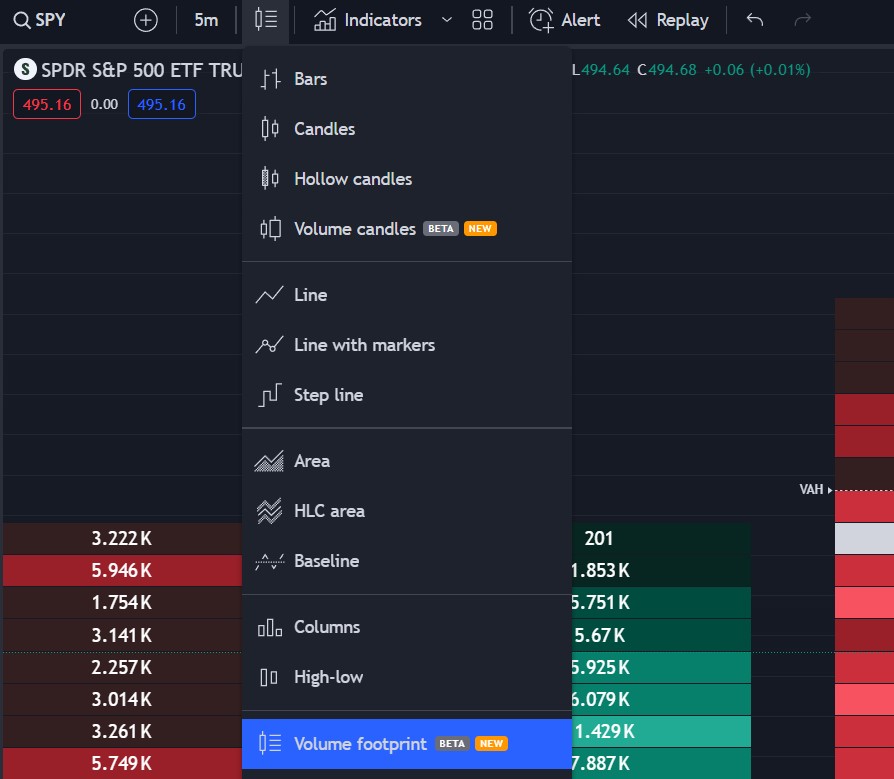
1- Click the chart type button at the top left of the screen, just to the left of the indicators button.
2- Click on “Volume footprint.”
You can access the footprint charts on any time frame, but it is mostly used on shorter timeframes for day trading. To access the native TradingVIew volume footprint indicator, you must have a Premium subscription or higher. However, you can use the link below to get a free trial to test footprint charts out free for 30 days.
Understanding Footprint Charts
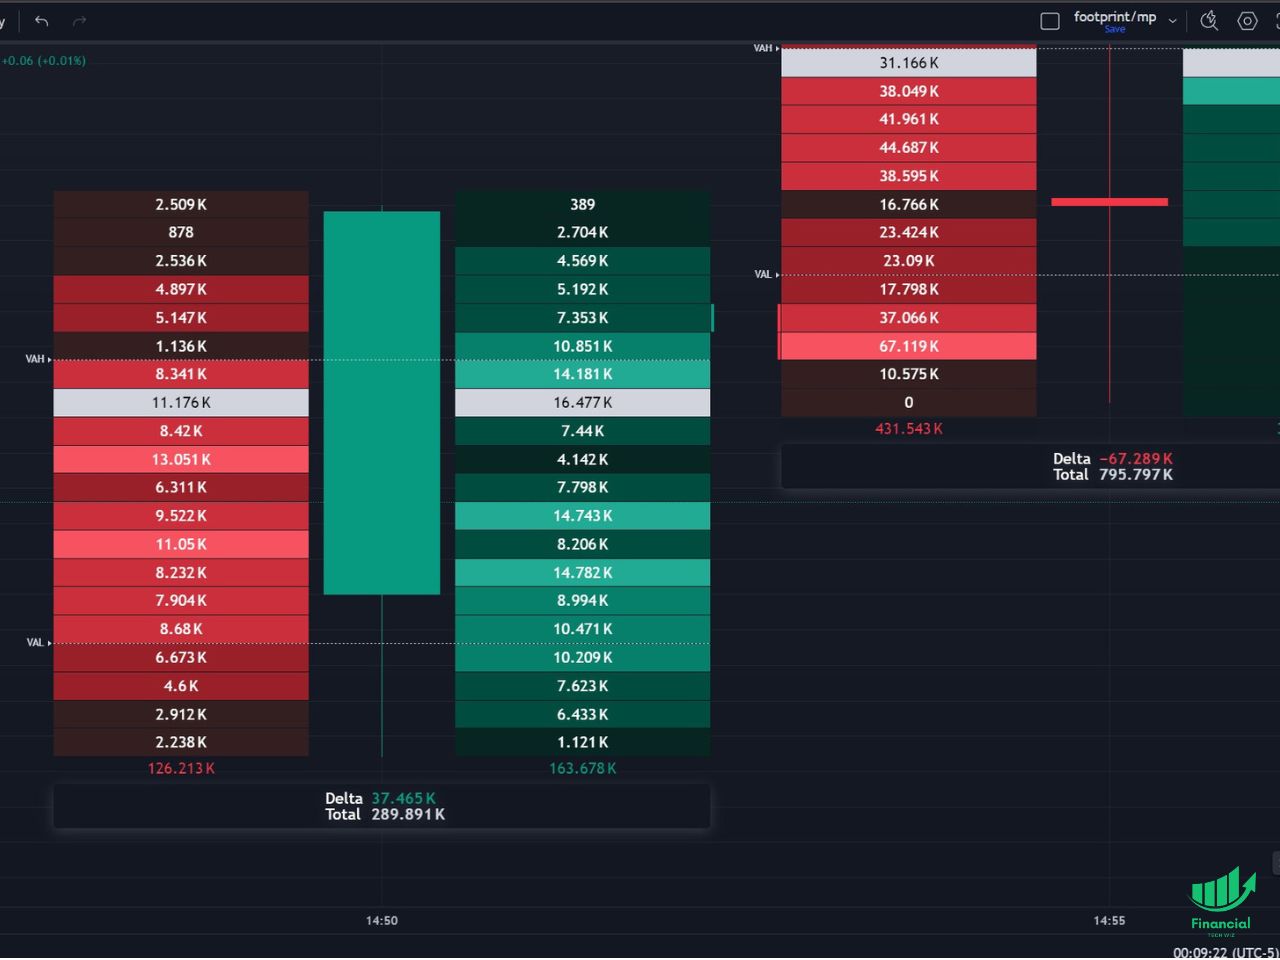
Footprint charts allow you to view how many orders have been filled on the bid and the ask. It is commonly used by day traders on the 1, 5, and 30-minute charts.
On the left side of the candle, you see sell orders in red, and on the left, the buy orders in green.
You can also view the delta and total volume traded for each candle at the bottom. A positive delta means there were more buy orders than sell orders filled at that candle, and vice versa for a negative delta.
Customizing the TradingView Footprint Settings
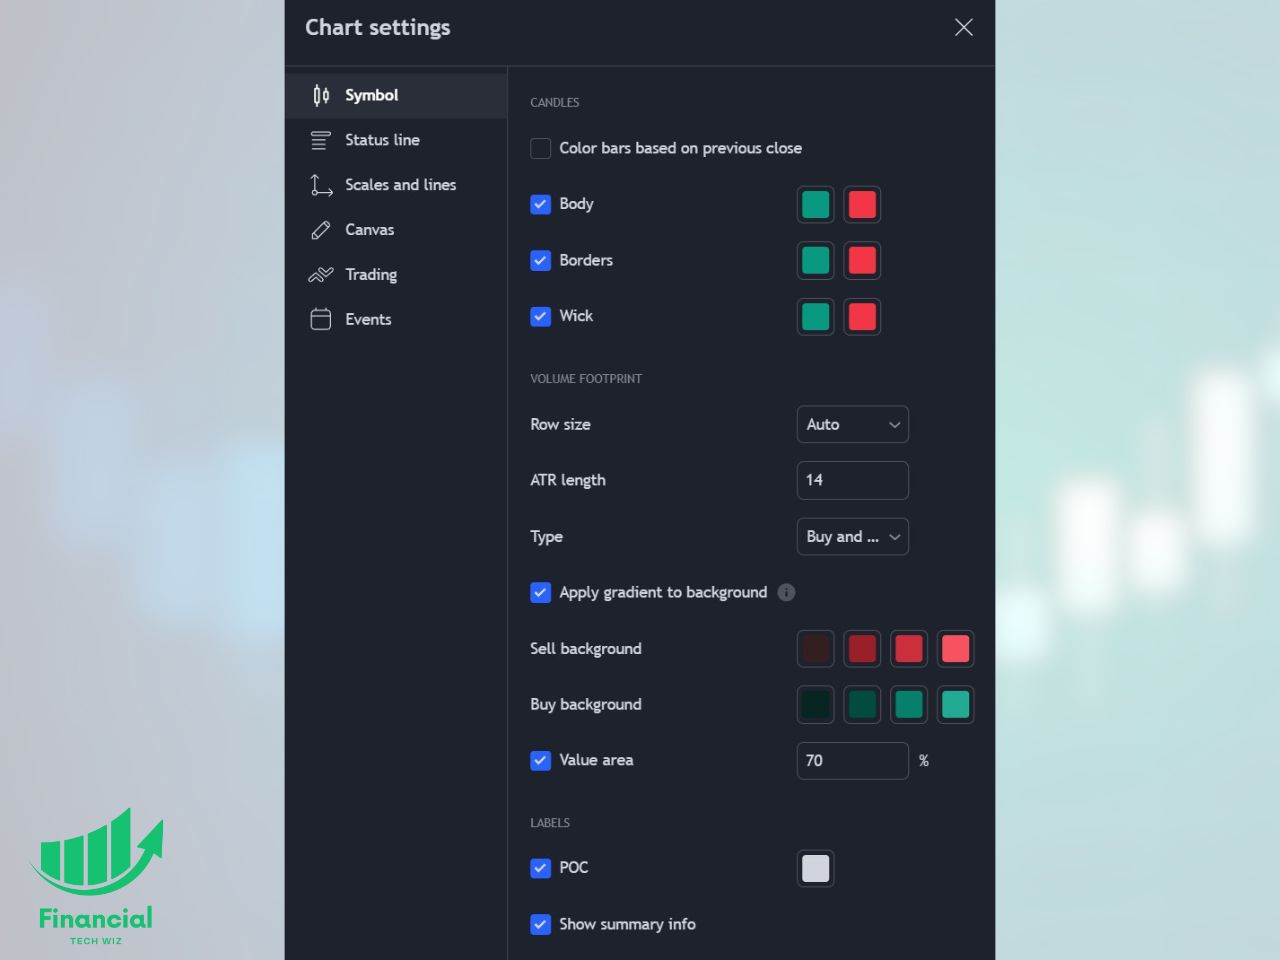
You can customize various settings for the footprint, including:
- Change the type to buy/sell, delta, or total volume
- Change the color of the POC (point of control)
- Customize the color of the candles and the buy and sell orders
Strategies for Trading with Footprint Charts
Custom footprint chart indicators can be utilized in various trading strategies:
- Identifying Key Levels: Footprint charts reveal areas of high liquidity and trading activity, helping traders pinpoint potential support and resistance levels.
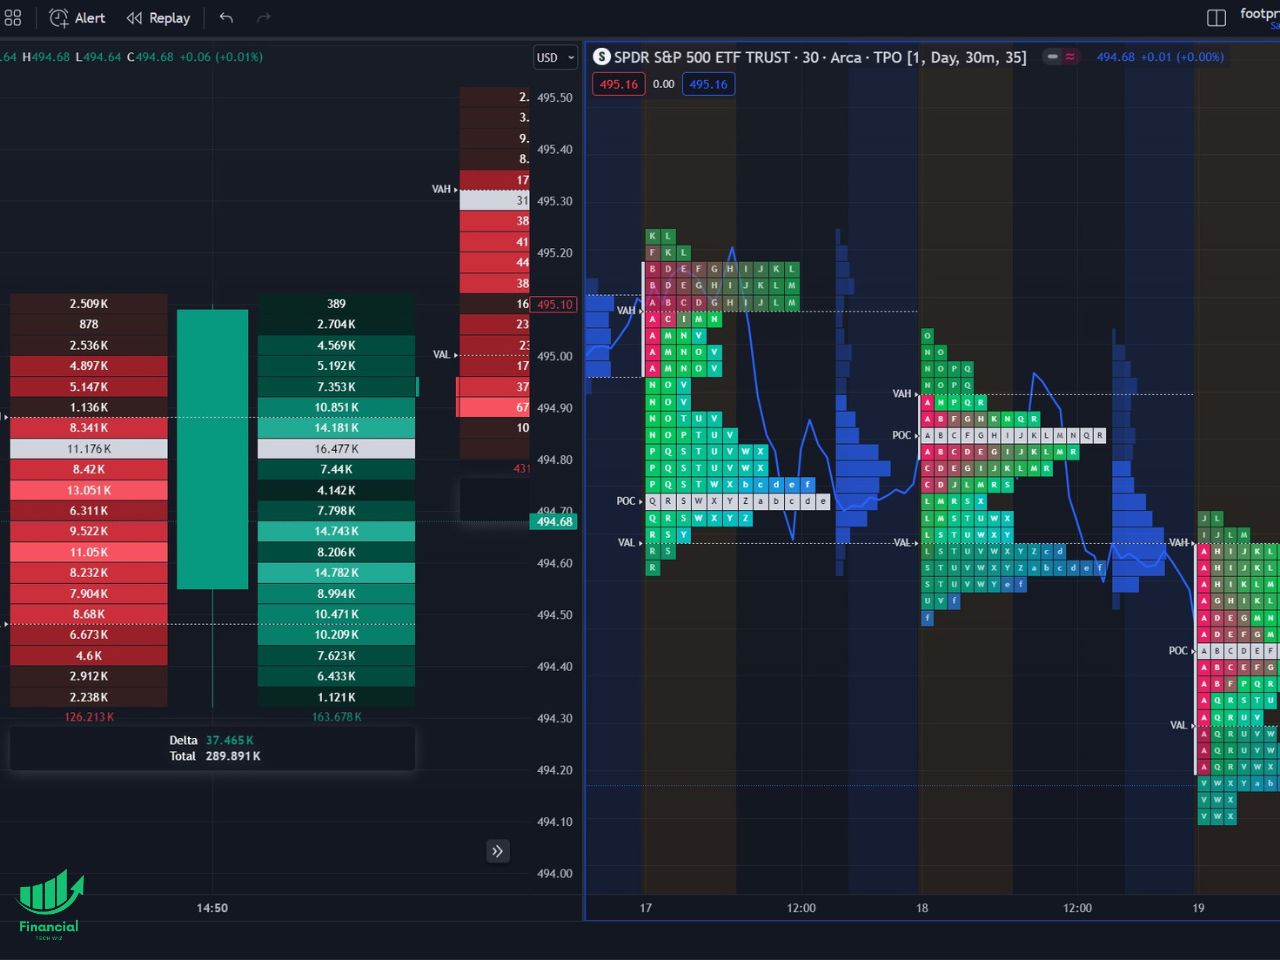
- Combine With the Market Profile: You can use the multiple charts features to view the market profile and the footprint charts on TradingView, allowing you to access several types of volume data on a single platform.
- Detecting Order Flow Imbalances: Significant discrepancies between buying and selling pressure may signal potential trend reversals or points of capitulation.
How to Get TradingView Footprint Charts for Free
While the native TradingView footprint chart indicator requires a Premium subscription, users can leverage custom indicators that replicate their functionality. Two notable custom indicators are “Footprint Classic” by Investor_R and “Footprint” by MarketWhisperer. While these are a decent free alternative, the native indicator works much better. Here is some more info about these custom indicators:
- Footprint Classic by Investor_R: This indicator analyzes volume data within candles, splitting it into up volume and down volume. It offers similar use to the native footprint chart, but it cannot analyze historical data, so you can’t refresh your chart or you will lose the data.
- Footprint by MarketWhisperer: Developed by MarketWhisperer, this indicator provides real-time analysis of order flow data, but it also requires the chart to be open and cannot analyze historic volume data.
How to Access and Use Custom Footprint Indicators on TradingView
Using custom footprint indicators on TradingView is a straightforward process:
- Navigate to the “Indicators” tab on the TradingView platform.
- Search for the desired custom indicator, such as “Footprint Classic” or “Footprint” by MarketWhisperer.
- Add the indicator to your chart and customize its settings according to your preferences.
TradingView Subscription Discount
Since the native TradingView footprint charts require a premium subscription, I recommend you use my affiliate link to get a free trial so you can test it out for free. A premium subscription also includes the market profile, volume profile, and the ability to add up to 8 charts per layout, making it a great value.
Exclusive Deal: 30-Day FREE Premium Access + Bonus Credit
Try TradingView’s Footprint Charts with No Cost – Start Your Free Trial Now!
- Access Footprint Charts
- Advanced Market Profile Tools
- Real-Time Data & Volume Analysis
FAQs
Does TradingView have footprint charts?
Yes, TradingView offers footprint charts as a native chart type called the volume footprint. There are also some custom indicators like the “Footprint Classic” by Investor_R and “Footprint” by MarketWhisperer. You can watch my video about the TradingView footprint charts below to see a visual tutorial:

Before you go
If you want to keep educating yourself about personal finance, you must check out these posts as well:
What is the Most Successful Options Strategy
Options Trading for Income: The Complete Guide
Mark Minervini’s Trading Strategy: 8 Key Takeaways
The Best Options Trading Books
The Best Laptops and Computers for Trading
How to Get a TradingView Free Trial
The Best TradingView Indicators
The Best Keyboards For Trading
This article contains affiliate links I may be compensated for if you click them.
Get Your Free Trading Resources
Grab the free trading journal template plus the same tools we use to stay organized, consistent, and objective.
- Free trading journal template
- Custom indicators, watchlists, and scanners
- Access our free trading community
Enter your email below to get instant access.
No spam. Unsubscribe anytime.


