Interactive Brokers vs. TradingView (2026): Pricing, Charts, Integration
Interactive Brokers and TradingView solve different problems for active traders. IBKR is the broker that executes the trade; TradingView is the chart and analysis platform that helps you decide what to trade. The two integrate directly, so this comparison covers pricing, features, and how to use them together rather than picking one over the other.
Key Takeaways
- TradingView integrates with Interactive Brokers: You can chart on TradingView and execute trades directly through your IBKR account.
- Different platforms, different purposes: Interactive Brokers is a brokerage for trade execution, while TradingView is a charting and analysis platform.
- Pricing differs significantly: Interactive Brokers charges per-trade commissions with no platform fees, while TradingView uses a subscription model ($0 to $60/month).
Recommended Tool
Financial Tech Wiz Trading Journal
If you trade IBKR positions and chart on TradingView, the Financial Tech Wiz Trading Journal pulls every IBKR fill through SnapTrade and gives you P&L by symbol, hold duration, and time of day across stocks, options, and futures. Starting at $9.91/month billed annually.
Try It Free- Low-cost trading: $0.65 per options contract
- Global market access across 150+ markets
- Integrates directly with TradingView charts
- Advanced charting with broker integration
- Alert-based strategies and indicators
- Free plan available, premium from $12/month
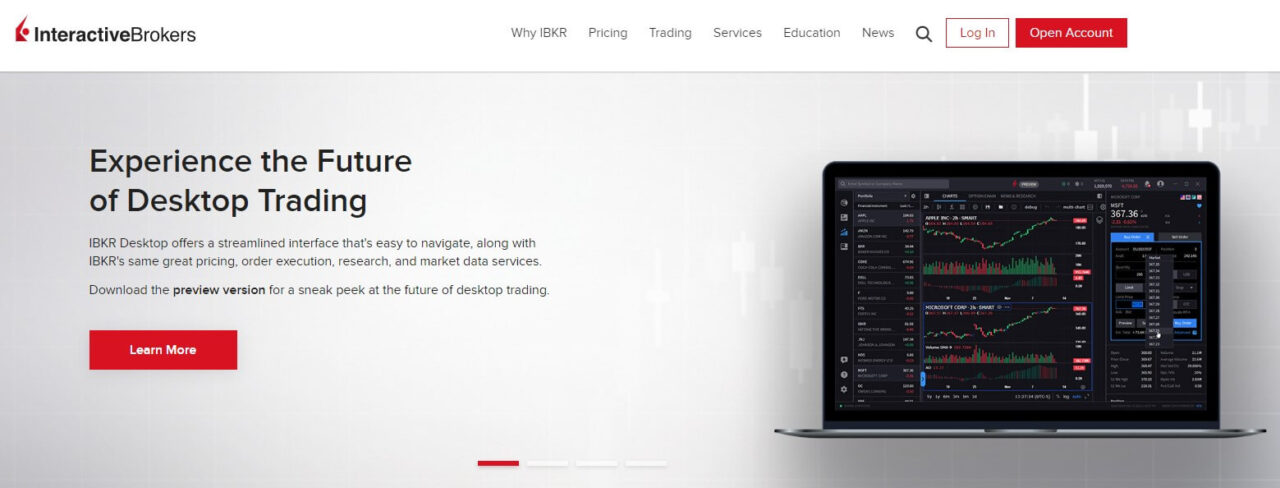
Overview of Interactive Brokers
Interactive Brokers (IBKR) is a well-established brokerage firm founded in 1978, known for providing advanced trading and investing services to a diverse clientele, including individual investors, institutions, and professional traders. IBKR offers competitive pricing for options and futures, but lacks when it comes to charting and ease of use.
✓ Advanced order types
✓ Best for automated trading
✓ Low options commissions
Interactive Brokers is Best For
Interactive Brokers is best for advanced traders who prefer to automate their trading strategies. IBKR is far from beginner-friendly, as the platforms are advanced and require some technical knowledge to utilize effectively. If you are looking for a modern, easy-to-use investing platform, IBKR is not your best option.
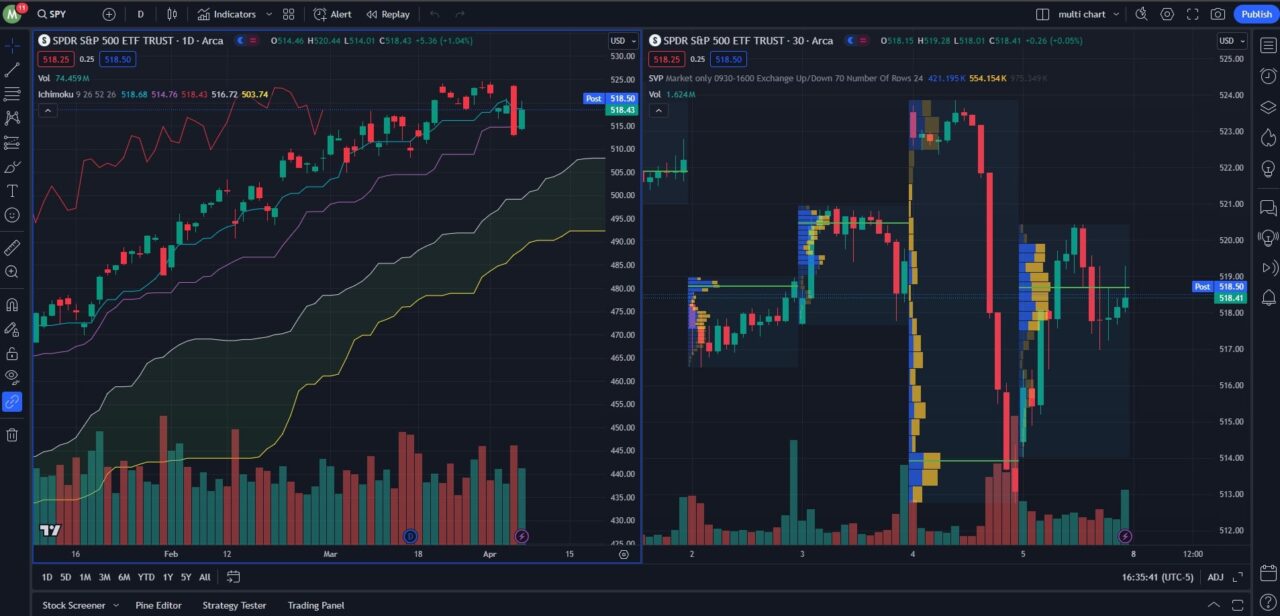
Overview of TradingView
TradingView is an advanced charting and social platform for traders. You can build custom indicators, backtest strategies, and utilize community scripts with its proprietary Pine Script coding language. TradingView is my top pick as the best overall charting platform, based on my experience of using nearly every trading and charting software available.
✓ Pricing: Free to $60/month
✓ Integrates with various brokers
✓ Best free charting software
TradingView is Best For
TradingView is best for traders and investors who want access to premium charting and community-made scripts. It provides everything you need to make informed trading decisions including screeners, heatmaps, economic calendars, plus you can integrate various brokers to trade directly from the charts. TradingView connects to a wide range of brokers beyond IBKR, including Alpaca, IG, Oanda, Tradier, and Tradovate, making it a broker-agnostic analysis layer that works with virtually any setup.
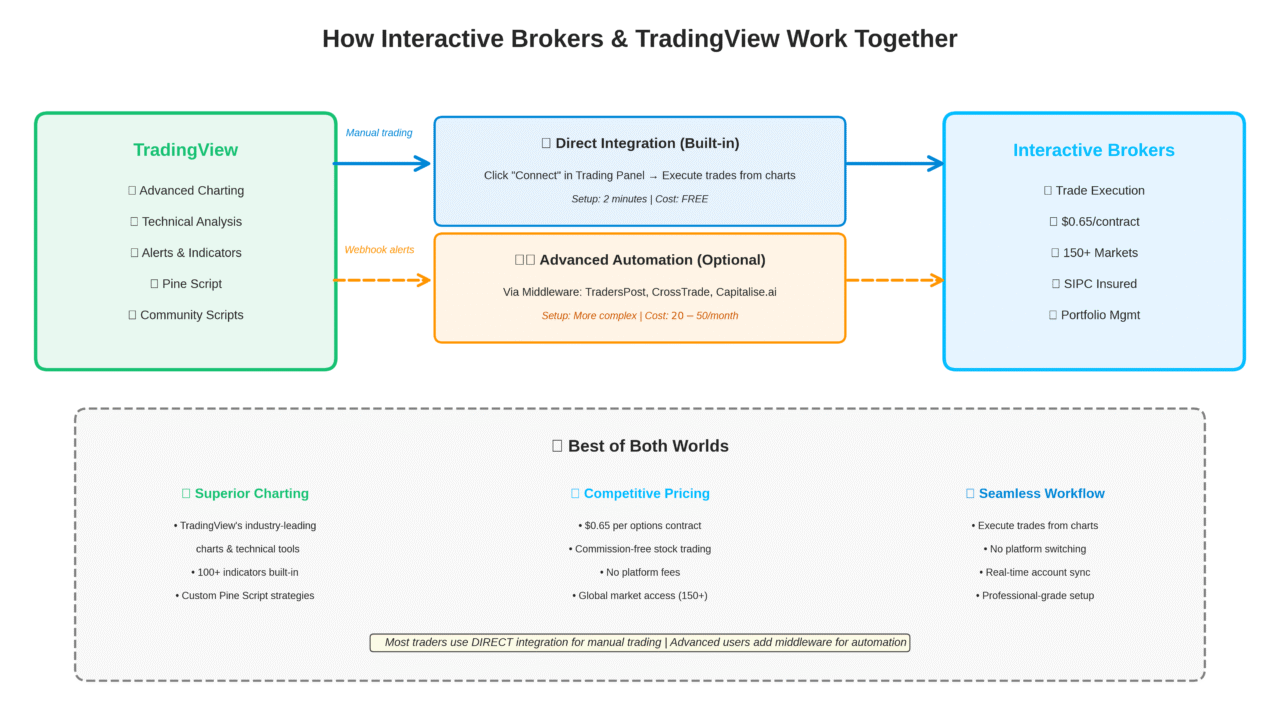
How the IBKR + TradingView Integration Actually Works
The integration between Interactive Brokers and TradingView is one of the most practical setups in retail trading: you analyze on TradingView, execute through IBKR. Here is how to set it up and what it can actually do.
Step 1: Meet the requirements. You need a funded Interactive Brokers account (live or paper trading works for testing). On the TradingView side, the broker integration requires an Essential plan or higher in most regions; the free plan supports chart analysis only.
Step 2: Connect the broker. Open any chart in TradingView and click the Trading Panel at the bottom of the screen. Choose Interactive Brokers from the broker list, then log in with your IBKR credentials. TradingView routes the authentication through IBKR’s secure login; your password is never stored on TradingView’s servers.
Step 3: Place a single order from a chart. Once connected, a green indicator confirms the live link. Right-click on the chart price level where you want to enter, select Buy or Sell, set your size and order type, and the order routes directly to IBKR. Fills appear in the Trading Panel within seconds.
Step 4: Use bracket orders and OCO from the chart. TradingView’s order panel supports bracket orders (entry plus stop plus target in one submission) and one-cancels-the-other (OCO) logic. These route as standard IBKR order types. Advanced order routing through IBKR’s 100+ order types (SMART routing, TWAP, VWAP, and more) still requires going directly into Trader Workstation.
Step 5: Understand what does not pass through. Complex multi-leg options strategies cannot be routed through the TradingView panel; submit those in TWS directly. Alerts and Pine Script signals can trigger visual notifications on TradingView, but automated execution from Pine Script to IBKR requires a third-party webhook router. The native integration covers single-leg and bracket orders for stocks, options, and futures. If you trade through IBKR’s TWS or IBKR Pro, the Interactive Brokers trading journal guide walks through how to import trade history into a structured journal.
PRICING AND COSTS COMPARISON
Understanding the cost structure of Interactive Brokers versus TradingView is crucial because they operate on fundamentally different pricing models. Interactive Brokers uses a traditional brokerage model where you pay per-trade commissions: $0.65 per options contract, and futures contracts at $0.85 commission plus exchange fees (totaling approximately $2.00 to $2.50 per side for standard contracts like E-mini S&P 500). Stock trading is commission-free for U.S. exchange-listed equities. There are no monthly platform fees or subscription costs to access Interactive Brokers’ trading platforms. However, you must purchase real-time market data subscriptions separately if you want live quotes, which can add $5 to $20+ monthly depending on which exchanges you need.
TradingView operates on a subscription-based software model. The platform offers a free tier with basic charting capabilities, but premium plans range from $12.95 to $59.95 per month and unlock features like multiple chart layouts, advanced technical indicators, alerts, and faster data refresh rates. TradingView provides real-time data for free when possible (particularly for crypto and forex), though you can purchase additional exchange data subscriptions if needed. Since TradingView is not a brokerage, there are no trading commissions, but you will still pay commissions to whichever broker you connect for trade execution.
Here is a side-by-side of what each platform actually costs at different usage levels:
| Cost Factor | Interactive Brokers | TradingView |
|---|---|---|
| Platform fee | $0/month | $0 to $60/month |
| Stock commission | $0 (US equities) | Not a broker |
| Options per contract | $0.65 | Not a broker |
| Futures per contract | $0.85 + exchange fees | Not a broker |
| Real-time market data | $5 to $20+/month (by exchange) | Included for many markets; paid add-ons available |
| Free tier | Full TWS access (no subscription) | Yes (limited chart layouts and indicators) |
| Integration with each other | No extra cost | No extra cost |
Key Characteristics of Interactive Brokers and TradingView
| Platform | Platform Type | Tradeable Assets | Charting Features | Data | Premium Pricing |
|---|---|---|---|---|---|
| Interactive Brokers | Brokerage Platform | Stocks, ETFs, Mutual Funds, Options, Futures, Futures Options, Crypto, Bonds | Downloadable desktop platforms, web platform, mobile app | Must buy real-time data | No premium features |
| TradingView | Charting Software | Not a broker, but you can chart stocks, ETFs, futures, crypto, and forex | Advanced web-based charting platform, downloadable desktop app, and mobile app | Provides real-time data for free when possible, and you can purchase real-time data subscriptions from exchanges | $12 to $60 per month |
The key distinction is that Interactive Brokers charges you based on trading activity, while TradingView charges for access to its software and features regardless of how much you trade. For active traders placing dozens or hundreds of trades monthly, Interactive Brokers’ per-contract fees can add up quickly. For example, an active futures trader executing 50 E-mini S&P 500 contracts monthly would pay approximately $112.50 in total costs ($2.25 per contract), while an options trader placing 100 contracts monthly would pay $65 in commissions. For casual traders or investors who make just a few trades per month, Interactive Brokers’ per-trade pricing may be more economical since you are only paying when you actually execute trades.
Important Note on Market Data: When connecting Interactive Brokers to TradingView, you may see an “Orange D” (delayed data warning) in the order panel even if you have real-time data subscriptions. This occurs because exchange regulations distinguish between chart data and order execution data. The most reliable setup is subscribing to market data through Interactive Brokers for order execution compliance, while understanding that TradingView charts may require separate data subscriptions for full real-time display across all exchanges. For a full breakdown of TradingView’s subscription tiers and what each unlocks, see the TradingView pricing breakdown.
Trading Costs and Commissions Compared
| Fee Type | Interactive Brokers | TradingView |
|---|---|---|
| Equity Commission | Free | Not a broker |
| Option Commission | $0.65 per contract | Not a broker |
| Futures Commission | $0.85 per contract, $0.25 micro | Not a broker |
| Futures Options Commission | $0.85 per contract, $0.25 micro | Not a broker |
| Option Exercise Fee | None | Not a broker |
Your cost-effectiveness ultimately depends on your trading frequency and style. High-volume futures traders should factor in the complete cost including exchange fees, not just the $0.85 commission, when calculating total expenses. Many traders find the optimal solution is using both: paying for TradingView’s charting capabilities ($12 to $60/month) while executing trades through Interactive Brokers’ competitive per-contract pricing. This combination provides professional-grade analysis tools with cost-effective execution.
Features and Tools Comparison
When comparing features, it is essential to recognize that Interactive Brokers and TradingView serve different primary functions. Interactive Brokers excels at trade execution and portfolio management features like margin trading, dividend reinvestment (DRIP), advanced order types, and account protections. As a registered broker-dealer, Interactive Brokers provides SIPC insurance (up to $500,000 including $250,000 for cash claims) and offers robust account management tools, tax reporting, and customer support for account-related issues.
TradingView’s strength lies entirely in analysis and charting capabilities. The platform offers superior technical analysis tools including 100+ built-in indicators, custom indicator creation via Pine Script, multi-timeframe analysis, extensive drawing tools, and a social community where traders share ideas and scripts. TradingView’s charting interface is widely considered the industry standard for visual analysis, with an intuitive design that makes complex technical analysis accessible. However, since TradingView is not a brokerage, it does not offer portfolio management features, insurance, or direct customer support for trade execution issues. For a deeper look at what each plan tier includes, see the full TradingView review.
Trading Features and Tools
| Platform | DRIP | Margin Trading | Insurance | Mobile App |
|---|---|---|---|---|
| Interactive Brokers | Yes, but with fees | Yes | SIPC Insured | Yes |
| TradingView | Not a broker | Not a broker | Not a broker | Yes |
Interactive Brokers provides comprehensive brokerage services including margin trading and regulatory protections, while TradingView focuses exclusively on charting and analysis. TradingView users must connect an external broker to actually execute trades, meaning you rely on that broker’s features for margin access, insurance coverage, and portfolio tools. TradingView also pairs with third-party order-routing tools via webhooks for traders who want to automate entry signals, though the native IBKR integration supports manual and semi-manual order entry without requiring middleware. For a look at how TradingView’s webhook system works with external services, see the overview of TradingView’s API.
Where They Differ
The core difference: Interactive Brokers is a regulated broker-dealer that holds your funds, executes trades, and provides SIPC insurance. TradingView is subscription-based charting software that connects to brokers for execution but does not hold your money or provide regulatory protections. IBKR targets active traders and institutions who need global market access, 100+ order types, and low commissions on options and futures. TradingView targets everyone from beginners learning technical analysis on the free plan to professionals building Pine Script strategies. IBKR’s Trader Workstation has a steep learning curve; TradingView is intuitive from day one. The two platforms are complementary by design: analysis on TradingView, execution on IBKR.
Who Should Pick Each Platform
The chart-first technical trader
If your trading decisions are driven by price action, indicators, and pattern recognition, TradingView is the non-negotiable starting point. You get Pine Script for custom indicators, a community of shared strategies, multi-timeframe layouts on paid plans, and screeners that filter across thousands of instruments. Add IBKR to execute the trades you identify on TradingView charts. The combination costs roughly $12 to $60/month for TradingView plus $0.65 per options contract (or $0 for equities) on IBKR.
The active multi-asset investor
If you trade stocks, options, futures, forex, and international markets from a single account, Interactive Brokers is the execution backbone. No other retail broker matches IBKR’s global market access (150+ markets), margin rates, and asset class breadth. TradingView becomes your research layer: chart the same instruments across time zones, set alerts, and route orders to IBKR when the setup triggers. Whichever broker you trade through, the Financial Tech Wiz Trading Journal pulls IBKR trade history through SnapTrade and applies P&L analytics across stocks, options, and futures.
The hybrid: chart on TradingView, execute on IBKR
Most serious active traders land here. TradingView handles all analysis, alert-setting, and idea sourcing. IBKR handles execution, account custody, and portfolio management. The native integration means you never leave TradingView to place a trade. For traders making 20+ trades per month, this setup delivers world-class charting with among the lowest execution costs in retail. If you want to test a journaling workflow before committing to a paid plan, the free trading journal template for Google Sheets covers the basics for tracking entries and exits.
WHICH PLATFORM IS BEST FOR YOU?
Choose Interactive Brokers if you need low-cost trade execution with global market access. It is ideal for active options and futures traders ($0.65 and $0.85 per contract), international investors accessing 150+ markets, and experienced traders comfortable with complex platforms who prioritize cost over simplicity. Use TradingView when advanced charting and technical analysis drive your trading decisions. It is perfect for traders who use multiple brokers, beginners learning technical analysis (free plan available), or anyone who values community-shared strategies and ideas. The platform shines for alert-based workflows where you monitor setups and route orders when signals fire.
When to Use Both Together
Combining both creates a professional setup: TradingView’s superior charting plus Interactive Brokers’ low-cost execution. This works best for active traders making 20+ monthly trades who rely on technical analysis. You get world-class charting tools while maintaining competitive execution costs: the optimal balance for serious traders.
Get Your Free Trading Resources
Grab the free trading journal template plus the same tools we use to stay organized, consistent, and objective.
- Free trading journal template
- Custom indicators, watchlists, and scanners
- Access our free trading community
Enter your email below to get instant access.
No spam. Unsubscribe anytime.
Frequently Asked Questions
Can you use TradingView with Interactive Brokers?
Yes, TradingView integrates directly with Interactive Brokers. Open the Trading Panel in TradingView, click the Interactive Brokers logo, then log in to your IBKR account to connect the platforms. Once connected, you can place trades directly from TradingView charts while the orders route through your Interactive Brokers account.
Is Interactive Brokers better than TradingView?
They serve different purposes, so one is not strictly better than the other. Interactive Brokers is a brokerage platform for executing trades with low costs and global market access, while TradingView is charting software for technical analysis and market research. Most serious traders use both together to leverage each platform’s strengths.
What is the difference between Interactive Brokers and TradingView?
Interactive Brokers is a regulated broker-dealer that holds your funds and executes trades, charging per-trade commissions with no platform fees. TradingView is subscription-based charting software ($0 to $60/month) that provides analysis tools but does not execute trades or hold your money; it must connect to a broker like Interactive Brokers for trade execution.
Can Interactive Brokers replace TradingView?
Interactive Brokers cannot replace TradingView for traders who prioritize advanced charting and technical analysis. While IBKR offers basic charting through Trader Workstation, its charting capabilities are dated and limited compared to TradingView’s sophisticated tools, community scripts, and Pine Script programming capabilities.
Which is better for beginners?
TradingView is friendlier for beginners because the free tier lets you learn charting and analysis without funding an account. Interactive Brokers’ Trader Workstation has a steeper learning curve aimed at active traders. Beginners often start with TradingView analysis, then add IBKR when they are ready to execute live trades.
Does Interactive Brokers charge for TradingView integration?
No. The integration itself is free from both sides. You pay your IBKR commissions on each trade and your TradingView subscription tier for chart features. There is no separate integration fee.
How do I connect TradingView to Interactive Brokers?
Open a chart in TradingView, click the Trading Panel at the bottom of the screen, choose Interactive Brokers from the broker list, then log in with your IBKR credentials. After authentication, the panel shows your IBKR positions and lets you place orders directly from the chart. The integration works on Essential, Plus, and Premium TradingView plans; the free plan supports analysis only without the trading panel.
Can you run automated trading on Interactive Brokers using TradingView Pine Script?
TradingView alerts can trigger Pine Script logic and route orders to Interactive Brokers through the native broker integration on supported regions, but Pine Script itself does not execute trades. For full automation, most traders pair TradingView alerts with a third-party order-routing service or use IBKR’s TWS API directly. The native integration is best for semi-automated workflows where you confirm each entry from the chart.
Is the TradingView and Interactive Brokers integration free?
Yes. There is no separate fee from either side for the integration itself. You pay your IBKR commissions on each trade and your TradingView subscription tier for chart features.
Interactive Brokers vs TradingView: Bottom Line
Interactive Brokers and TradingView are not competitors; they are a natural pair. IBKR gives you global market access and competitive execution costs. TradingView gives you the charting and analysis layer that IBKR’s own platforms cannot match. The native integration removes the friction of switching between two windows, and the combination costs less than most standalone active trading platforms when you account for the savings on commissions.
For more detailed reviews and comparisons, continue exploring our other articles on brokerage platform comparisons.
Exclusive Deal: 30-Day FREE Premium Access + Bonus Credit
Don’t Miss Out – Sign up for TradingView Now!
- Advanced Charts
- Real-Time Data
- Track all Markets
TradingView offers a 30-day free trial of its premium features and a $15 credit toward your first paid month when you sign up through the link in the panel above. Signing up for the trial is not required; the free tier covers most chart and indicator basics. You can read my full review of TradingView to learn more.
Related Trading Platform Comparisons
Interactive Brokers vs tastytrade
Get Your Free Trading Resources
Grab the free trading journal template plus the same tools we use to stay organized, consistent, and objective.
- Free trading journal template
- Custom indicators, watchlists, and scanners
- Access our free trading community
Enter your email below to get instant access.
No spam. Unsubscribe anytime.


