cup and handle pattern

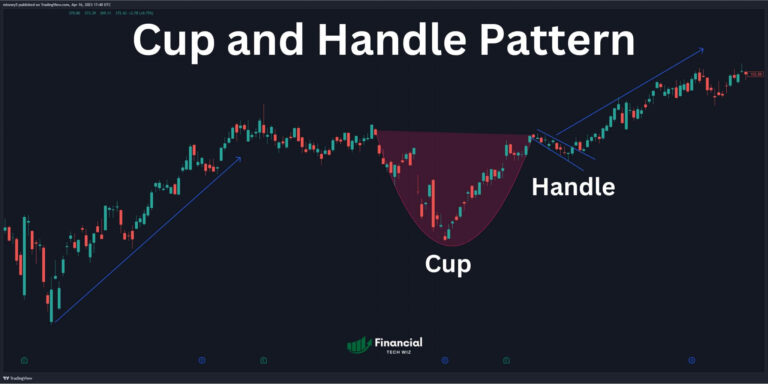
Cup and Handle Pattern: How You Can Trade It

The cup and handle is a bullish candlestick pattern used by many professional traders, including Mark Minervini and William O’Neil. Minervini used this strategy to win multiple U.S. Investing Championships.  Let’s dive deeper into this technical pattern so you can learn how to implement it into your trading strategy. The Origins of the Cup and…

market profile on tradingview

TradingView TPO Charts Explained (TradingView Market Profile)

The market profile is an advanced indicator that displays a combination of time spent and volume traded at each price level. It is generally only applicable to day traders, but it can also be used to determine optimal entry and exit points for swing trading.  In this comprehensive guide, we’ll explore the the history, concepts,…

tick index

Tick Index: Mastering Intraday Trading Insights

The financial markets are dynamic and ever-evolving. Amid the noise of price movements, traders and investors seek tools to gauge market sentiment and make informed decisions. One such tool is the Tick Index. In this article, we’ll explore the Tick Index, its interpretations, and its applications in trading. Understanding the Tick Index and Its Significance…

volatility contraction pattern

Volatility Contraction Pattern: VCP Trading Mastery

The Volatility Contraction Pattern (VCP) is a powerful trading pattern that has gained popularity and recognition among traders around the globe. This pattern, with its high success rate and low-risk nature, presents a unique opportunity for traders to capitalize on explosive price movements. In this article, we’ll explore the origins of the VCP and shed…

bear trap stock pattern chart

Bear Trap Stock Pattern: A Comprehensive Guide for Traders

The financial market is dynamic and ever-changing, where traders and investors continuously seek opportunities to maximize profits. In this pursuit, market participants must be aware of certain technical patterns that could lead to unexpected outcomes. One such pattern is the bear trap—an event that can catch even seasoned traders off guard. In this guide, we’ll…

harmonic scanner
|

Harmonic Scanners on TradingView: A Comprehensive Guide

Harmonic Scanner on TradingView | Introduction Harmonic patterns are a fascinating and powerful tool in the world of trading. Based on Fibonacci numbers, these geometric price structures provide traders with potential entry and exit points in various financial markets. TradingView, a popular charting and technical analysis platform, offers harmonic scanner indicators that detect and analyze…

pinescript tradingview
|

Pine Script in TradingView: Ultimate Guide

Pine Script TradingView Introduction Pine Script is a versatile and user-friendly programming language developed by TradingView. It provides traders and analysts with a powerful toolset for creating custom trading indicators and strategies. In this article, we’ll explore the key features of Pine Script, its benefits, limitations, and how you can make the most of it…

evening doji star

Evening Doji Star Pattern: Decoding the Reversal Pattern

Introduction to the Evening Star Pattern Candlestick patterns are a powerful tool in the world of technical analysis, providing traders with valuable insights into potential price movements. Among these patterns, the Evening Doji Star stands out as a strong bearish reversal pattern that technical analysts often rely on to predict potential downtrends. In this article,…

gravestone doji

Gravestone Doji: Understanding the Bearish Reversal Signal

Candlestick patterns play a pivotal role in technical analysis, helping traders identify potential price trends and make informed trading decisions. One such pattern that garners the attention of traders is the gravestone doji. This article will explore the characteristics, interpretation, and practical application of this important bearish reversal signal. Understanding the Gravestone Doji The gravestone…

dragonfly doji

Understanding the Dragonfly Doji Candlestick Pattern

Dragonfly Doji Introduction Candlestick patterns are powerful tools used by traders and investors to analyze price movements and make informed trading decisions. Among the various candlestick patterns, one that stands out for its unique appearance and potential significance is the dragonfly doji. This article will explore the characteristics, interpretation, and practical use of this intriguing…