
Inverse Cup and Handle Pattern: How to Trade It

The inverse cup and handle is a bearish chart pattern, the mirror image of the classic bullish cup and handle. It shows up as an upside-down rounded top (the inverted cup) followed by a brief upward drift (the inverted handle), and it usually signals that an uptrend is running out of buyers. Traders also call it the inverted cup and handle, the reverse cup and handle, or simply the upside down cup and handle. They are all the same shape pointing the same direction: down. This guide covers how to spot it, how to confirm it with volume, and exactly where to enter, stop, and take profit.
Key Takeaways
- The inverse cup and handle is a bearish reversal or continuation pattern: an inverted rounded top plus a small rising handle, confirmed when price breaks below the neckline.
- Volume should fade through the cup and stay light on the handle, then expand on the breakdown. A breakdown on weak volume is the most common false signal.
- Measure the cup’s depth from the rim to the bottom of the dome, then project that distance down from the neckline for your price target. Place the stop just above the handle high.
Track your pattern trades
Financial Tech Wiz Trading Journal
Logging every inverse cup and handle setup is how you find out whether the pattern actually works for you. The journal records your entries, stops, and exits, then shows your win rate and average return by symbol and hold time so you can trade the setup with real numbers instead of a hunch.
Start tracking your setupsIs the Inverse Cup and Handle Bullish or Bearish?
Bearish. The regular cup and handle is bullish because the cup is a rounded bottom and the handle drifts down before a breakout higher. The inverse flips both: the cup becomes a rounded top and the handle drifts up before a breakdown lower. It most often acts as a bearish continuation inside a downtrend, but it can also mark a reversal at the end of an uptrend when it forms after an extended run. If you want to see the two shapes side by side, read the full cup and handle pattern guide.
Anatomy of the Pattern
Breaking the formation into labeled parts makes it far easier to spot in real time. An inverse cup and handle has three pieces that must line up.
The Inverted Cup (Rounded Top)
Price rounds over into a smooth dome rather than a sharp peak. The smoother and more symmetrical the dome, the more reliable the pattern. Sharp V tops are not inverse cups; they are a different, faster reversal. You want to see buyers gradually lose momentum, roll the price over, and then drive it back down toward the level where the dome started.
The Handle (Brief Rise)
After the right side of the dome, price stages a shallow recovery or sideways drift, usually retracing a third to a half of the cup’s right side. This is the last push from buyers before supply takes over. A good handle is shallow and short. A deep, drawn-out handle weakens the setup because it tells you buyers still have real strength.
The Neckline
The neckline is the support level connecting the cup’s rim lows. The pattern is not valid or tradable until price closes below this line. Until that break happens, you have a rounded top and a hopeful theory, not a trade. Draw the neckline carefully across the clearest support touches, because a sloppy neckline leads to sloppy entries.
Volume: The Confirmation Most Traders Miss
Volume is the single most useful confirmation signal, and most traders skip it. The ideal volume signature runs like this: heavy early in the dome as the last buyers pile in, fading toward the rounded top as momentum stalls, light and quiet through the handle, then a clear expansion on the neckline breakdown as sellers take control.
A breakdown on weak volume is the number one reason the pattern fails. Volume is what separates a real inverse cup and handle from random chop that happens to look like one. To watch momentum and volume together, pair the pattern with tools from our best TradingView indicators roundup.
How Reliable Is the Inverse Cup and Handle?
Chart patterns are probabilities, not guarantees. Some studies suggest the inverted cup and handle breaks down in roughly six of ten cases, with an average decline in the high-teens percent when it works. Treat those figures as rough context, not a promise.
Reliability rises sharply when three conditions line up: a symmetrical dome, a shallow handle, and a volume-confirmed breakdown. It falls apart on choppy, asymmetric domes and on low-volume breaks. If two of the three are missing, you are guessing, not trading a pattern.
How to Trade the Inverse Cup and Handle (Entry, Stop, Target)
Once the shape is confirmed, the trade comes down to three decisions: where to enter, where to place the stop, and where to take profit.
Entry
Enter on a confirmed close below the neckline, ideally with above-average volume. More conservative traders wait for a retest of the broken neckline as new resistance, then enter on the rejection. The retest gives you a tighter stop and better proof that the level has flipped from support to resistance.
Stop Loss
Place the stop just above the handle high, with a 2 to 3 percent buffer to absorb noise. If price reclaims the handle high, the pattern has failed and there is no reason to stay short.
Price Target (Measured Move)
Measure the cup’s depth from the neckline to the top of the dome, then project that same distance down from the breakdown point. That projected level is your measured-move target. It is not a ceiling on the move, just a reasonable first objective to bank profit or tighten the stop.
Worked Example
Say a stock domes from 100 up to 110 and back down to a 100 neckline, giving a cup depth of 10 points. The handle drifts up to 103, then price breaks down through 100 on rising volume. You enter the short near 100 and set your stop at about 105.10, just above the 103 handle high plus a small buffer. Your measured-move target is near 90 (the 100 breakdown minus the 10-point cup depth). That is roughly 10 points of reward against about 5 points of risk, a 2-to-1 setup before you account for slippage.
Inverse Cup and Handle Example on QQQ ETF
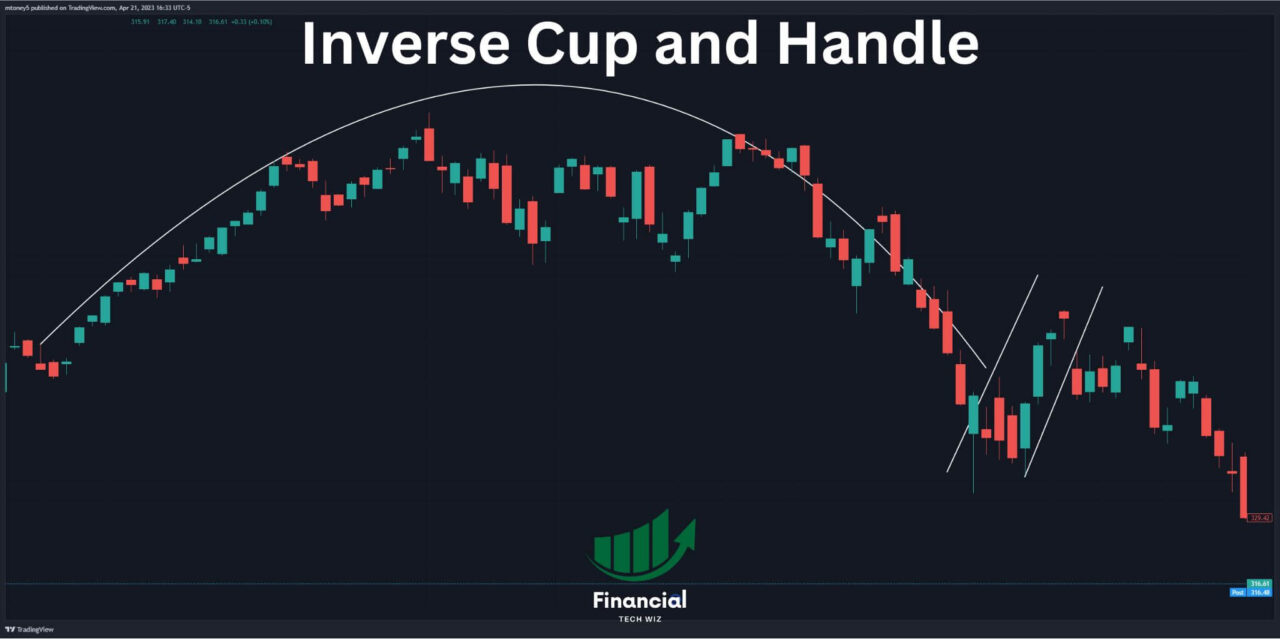
The inverse cup and handle was clearly visible on the QQQ ETF at the end of 2021 on the daily timeframe. Price rounded over into a broad dome, put in a shallow handle, and then broke down, which turned out to mark the start of the 2022 decline.
You can see the shape more easily after marking it up with the drawing tools on TradingView. To trade it, you would short when price broke below the trendline furthest to the right, set your stop above the handle high, and project the cup depth downward for your target. For practice, pull up the QQQ daily chart in 2021 and see if you can spot the dome and handle yourself.
Inverse Cup and Handle vs. Other Bearish Patterns
The inverse cup and handle is easy to confuse with other bearish reversals, so it helps to know the key visual differences. It can look like a head and shoulders pattern, but a head and shoulders has three distinct peaks with a taller middle peak, while the inverse cup is one smooth rounded dome with no separate shoulders.
It also sits in the same bearish-reversal family as the double bottom pattern seen from the opposite side: a double top makes two sharp equal-height peaks, whereas the inverse cup makes one continuous curved top. When in doubt, ask whether the top is a single smooth dome (inverse cup) or a set of distinct peaks (head and shoulders or double top).
Common Mistakes That Trap Traders
Most losing inverse cup and handle trades come from the same handful of errors. Trading the pattern against a strong primary uptrend puts you on the wrong side of the bigger trend. Entering before the neckline actually breaks means you are trading a shape that has not confirmed. Ignoring a weak-volume breakdown is the classic trap that leads straight into a failed break. Drawing the neckline carelessly gives you a bad reference for both entry and target. And using a stop that sits too tight inside the handle’s noise gets you shaken out right before the real move. Each of these ties back to a rule above: wait for the close below the neckline, demand volume, and give the stop room above the handle high.
Spotting the Pattern in Real Time
To catch these setups as they form rather than after the fact, set price alerts just below the neckline so you are notified the moment a break is possible. Scan daily and weekly charts for smooth rounded tops rather than sharp peaks, then wait for the shallow handle to appear. The hard part is patience: most rounded tops never complete into a clean pattern, so you are filtering for the few that do. Journaling each attempt, including the ones that failed, is how you learn which domes and handles actually work in the markets you trade.
New to tracking setups?
Free Trading Journal Template
Start simple. Our free Google Sheets journal lets you log each inverse cup and handle trade with its entry, stop, target, and outcome, so you can spot whether the pattern is paying you before you commit to anything more.
Get the free templateFinal Thoughts
The inverse cup and handle is a high-probability bearish setup, but only when the dome is clean, the handle is shallow, and the breakdown is volume-confirmed. Skip the ones where those conditions are missing and you will avoid most of the false signals. Log every attempt and let your own data decide whether the pattern earns a place in your playbook. When you are ready to keep learning, explore more setups in our full chart patterns guide, or study a tightening bullish setup in the volatility contraction pattern.
Frequently Asked Questions
What is the opposite of the cup and handle pattern?
The inverse cup and handle is the opposite of the standard cup and handle. The regular pattern is a rounded bottom with a downward handle that breaks out higher (bullish). The inverse flips it into a rounded top with an upward handle that breaks down lower (bearish).
How reliable is the reverse cup and handle?
Like all chart patterns it is a probability, not a guarantee. Some studies suggest it breaks down in roughly six of ten cases. Reliability improves when the dome is symmetrical, the handle is shallow, and the breakdown comes on expanding volume. A breakdown on weak volume is the most common false signal.
Is the inverse cup and handle bullish or bearish?
Bearish. It signals that buyers are losing control and price is likely to continue or reverse lower once it breaks the neckline.
What is the difference between an inverted, reverse, and upside down cup and handle?
Nothing. Inverted, reverse, and upside down are three names traders use for the same bearish pattern. They all describe a rounded top followed by a small rising handle and a breakdown.
Where do you set the price target on an inverse cup and handle?
Measure the depth of the cup from the neckline to the top of the dome, then project that same distance downward from the breakdown point. That projected level is the measured-move target.
Get Your Free Trading Resources
Grab the free trading journal template plus the same tools we use to stay organized, consistent, and objective.
- Free trading journal template
- Custom indicators, watchlists, and scanners
- Access our free trading community
Enter your email below to get instant access.
No spam. Unsubscribe anytime.







