
Hanging Man Candle: How to Trade the Bearish Reversal

A hanging man candle shows up after a run of rising prices and looks like a warning sign: a small body sitting on top of a long lower wick, as if the price nearly fell out from under itself before buyers dragged it back up. It is one of the more recognizable single-candle patterns in technical analysis, but on its own it predicts almost nothing. This guide covers what the pattern actually shows, how to tell it apart from a hammer or a gravestone doji, and the confirmation rules that separate a real signal from noise.
Key Takeaways
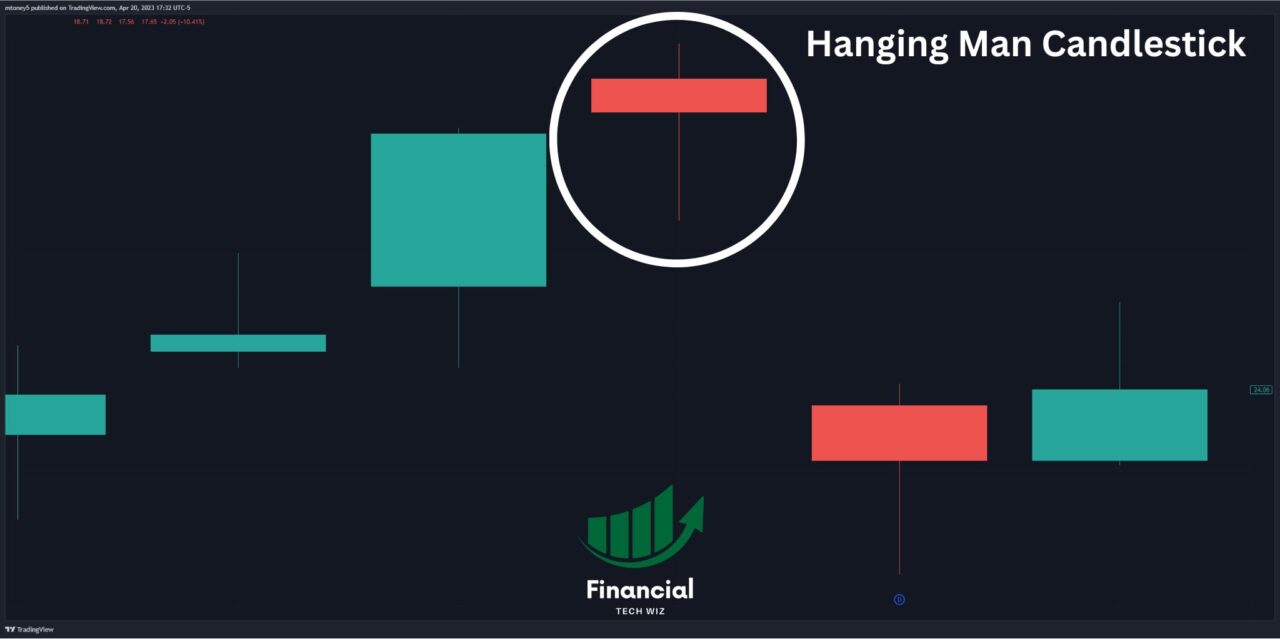
- A hanging man forms after an uptrend: a small body at the top of the candle, a lower shadow at least twice the length of the body, and little to no upper shadow. Body color does not matter.
- Formal testing of the pattern lands close to a coin flip (roughly 59% of hanging man candles resolve as a bullish continuation, not a bearish reversal), so treat it as something to watch for, not a signal to act on alone.
- Wait for a confirming candle that closes below the hanging man’s close before entering a short, and place a stop above the pattern’s high.
Track Your Setups
See If Your Hanging Man Trades Actually Work
The Financial Tech Wiz Trading Journal logs every trade automatically from 25+ brokers, so you can look back at every hanging man setup you have traded and see your real win rate, not your memory of it.
If you are just starting to log trades by hand, our free trading journal template is a simple place to begin before you are ready for a full platform.
What Is a Hanging Man Candle?
The hanging man is a single-candle bearish reversal pattern that appears after a price has been climbing. It gets its name from its shape: a small real body perched near the top of the candle’s range, hanging above a long lower shadow, like a stick figure dangling by its head. Three features define it:
- A small body located at the top of the candle
- A long lower shadow that is at least twice the length of the body
- Little or no upper shadow
The real body’s color is not important; it can be green or red. What matters is that sellers pushed price sharply lower during the session, and buyers only partially recovered it by the close. That tug of war, happening after a sustained uptrend, is what makes the hanging man worth watching. It is one of many single and multi-candle reversal setups worth learning; our chart patterns guide covers the full library, from candlestick shapes to ICT concepts like order blocks and fair value gaps.
Hanging Man vs. Hammer, Inverted Hammer, and Gravestone Doji
Several single-candle patterns share the hanging man’s small-body, long-shadow shape. The prior trend and the position of the shadow are what tell them apart:
| Pattern | Appears After | Shape | Typical Bias |
|---|---|---|---|
| Hanging Man | Uptrend | Small body at top, long lower shadow | Bearish reversal |
| Hammer | Downtrend | Small body at top, long lower shadow | Bullish reversal |
| Inverted Hammer | Downtrend | Small body at bottom, long upper shadow | Bullish reversal |
| Gravestone Doji | Uptrend | No real body, long upper shadow | Bearish reversal |
The hanging man and the hammer look identical; the only difference is what came before them. When the close sits above the open, it forms a green hammer candle, which carries slightly more bullish conviction. The Inverted Hammer flips the shadow to the top of the candle but keeps the same bullish, downtrend-only context. The Gravestone Doji is the hanging man’s mirror image: instead of a long lower shadow and a small body, it has a long upper shadow and no real body at all, since the open and close land at nearly the same price.
How to Confirm a Hanging Man Before You Trade It
A hanging man on its own is a caution flag, not a trade signal. Before acting on one, look for:
- The pattern forming after a clear upward price trend, not a sideways chop
- A confirmation candle on the following session that closes below the hanging man’s close
- Heavier than average volume on either the hanging man candle or the confirmation candle
Thomas Bulkowski’s pattern research suggests hanging man candles with heavy volume and a longer lower shadow tend to be better predictors of a move lower. If the confirmation candle is a full-bodied red bar that swallows the hanging man’s body outright, the setup upgrades into a bearish engulfing pattern, which carries its own entry and stop rules and is generally a stronger signal than the hanging man alone.
A Hanging Man Trade, Step by Step
Say a stock has climbed steadily from $40 to $58 over three weeks. On the next session it opens at $58.50, trades up to $58.70, sells off intraday to $56.80, then recovers to close at $58.20. That candle has a tiny body ($58.20 to $58.50, about 30 cents) sitting on a lower shadow that stretches from $58.20 down to $56.80, roughly $1.40, well over twice the body size, with almost no upper shadow above the open. That is a textbook hanging man.
A trader watching for confirmation does nothing yet. The next session opens at $57.90 and closes at $56.50, below the hanging man’s $58.20 close on above-average volume. That is the confirmation. An entry near $56.50 with a stop placed above the hanging man’s high of $58.70 risks about $2.20 per share. A trader targeting a 2:1 reward-to-risk ratio would look for roughly $4.40 of downside, or a target near $52.10, before covering.
How Reliable Is the Hanging Man Pattern?
Empirical research on candlestick reliability, including Bulkowski’s own backtesting, has found that hanging man candles resolve as a bullish continuation roughly 59% of the time, which is close to random and, on the surface, the opposite of what the pattern’s name implies. That number is not a reason to ignore the pattern; it is a reason to never trade it alone. The candles that hold up better in testing tend to share two traits: a lower shadow noticeably longer than twice the body, and volume that spikes on the candle itself or on the confirmation day. A hanging man that barely meets the shape definition, on light volume, with no follow-through, is closer to noise than signal.
Several factors also shape how the pattern performs in practice. The broader market environment matters: a hanging man that forms during a powerful bull run is less likely to trigger a real reversal than one that forms as momentum is already fading. Nearby support levels can absorb the selling pressure the pattern implies. And fundamental catalysts, earnings, economic data, geopolitical news, can override any technical signal entirely.
Risk Management for Hanging Man Trades
- Place a stop-loss order above the high of the hanging man candle to define your risk before you enter.
- Size the position based on the distance to that stop, not on a fixed share count.
- Layer on additional confirmation tools, moving averages, RSI divergence, or volume profile, rather than trading the candle shape in isolation. Our guide to the best TradingView indicators covers the ones worth adding to a reversal watchlist.
Over the years I have found that pulling up the actual chart, rather than eyeballing a screenshot, makes the shadow-to-body ratio and the volume context much easier to judge. TradingView is a solid place to review your own hanging man setups against volume and moving averages side by side.
Chart It Yourself
Review Hanging Man Setups on TradingView
TradingView’s charting tools make it easy to spot the shadow-to-body ratio, check volume on the candle and the confirmation day, and layer on the indicators that back up (or rule out) a hanging man signal.
Further Considerations: Limitations and Variable Performance
As with any single-candle pattern, the hanging man is not infallible, and its close-to-random base rate underscores that. A few conditions tend to weaken it further: a hanging man that forms within a third of the year’s high is more likely to act as a continuation of the existing uptrend than a reversal of it. A hanging man that appears just above a strong support zone may see buyers step back in before any real selling develops. And a hanging man that forms the day before an earnings report or major economic release is telling you far less about supply and demand than the news event that follows it.
The Bottom Line
The hanging man candle is worth knowing, but it is a prompt to pay closer attention, not a standalone sell signal. Confirm it with a follow-through candle, weigh the volume, check the broader trend and any nearby support, and size your risk around a stop above the pattern’s high. Used that way, alongside other technical and fundamental analysis, it earns its place in a trader’s toolkit.
FAQ
What does a hanging man candle mean?
A hanging man candle means sellers took control during the session, pushing price well below the open, before buyers pulled it back up by the close. Appearing after an uptrend, it is an early warning that the buying pressure driving the trend may be weakening, though it needs confirmation before it should change how you trade.
How to confirm hanging man?
Confirm a hanging man by waiting for the next candle to close below the hanging man’s own close, ideally on above-average volume. If that confirming candle is a full-bodied red bar that engulfs the hanging man’s body, the setup strengthens into a bearish engulfing pattern.
What is the difference between a hanging man candle and a hammer candle?
The two look identical, a small body at the top of the candle with a long lower shadow, but the prior trend decides which one you are looking at. A hammer forms after a downtrend and signals a possible bullish reversal. A hanging man forms after an uptrend and signals a possible bearish reversal.
What is the opposite of a hanging man candle?
The inverted hammer is the closest structural opposite: it forms after a downtrend rather than an uptrend and has its long shadow on top instead of on the bottom, with a bullish rather than bearish bias. The gravestone doji is the closer visual mirror, since it also appears after an uptrend, but with the long shadow flipped to the top of the candle and no real body at all.
This article contains affiliate links I may be compensated for if you click them.
Get Your Free Trading Resources
Grab the free trading journal template plus the same tools we use to stay organized, consistent, and objective.
- Free trading journal template
- Custom indicators, watchlists, and scanners
- Access our free trading community
Enter your email below to get instant access.
No spam. Unsubscribe anytime.







