Triangle Chart Pattern: How to Trade All 3 Types
Most chart patterns are loud. The triangle pattern is quiet. Price coils inside two converging trendlines, volume thins out, and most traders walk away bored just before the move that pays. The point of this guide: keep you watching when the screen looks like nothing is happening, then give you a clean rule set for entering, stopping, and sizing the trade once the triangle finally breaks. For the broader toolkit behind pattern reading, see our best technical analysis books guide.
We will cover the three triangle types (ascending, descending, symmetrical), how to confirm a breakout instead of chasing a fake, where to put the stop, and how to project a price target using the height of the pattern itself.
Key Takeaways
- Triangles are continuation patterns most of the time, so the breakout direction usually matches the trend that came in.
- Volume is the tell: a breakout on a real volume spike has follow-through, a breakout on dead volume usually fails inside two bars.
- The price target is the height of the triangle (widest point) added to the breakout level. The stop sits on the other side of the trendline.
Spotting a triangle is half the work. The other half is logging the entry, the stop, and the result so you can see whether your triangle setups actually pay over 30 trades, not just on the one chart you remember.
Try the journalWhat is a triangle pattern?
A triangle pattern is a technical analysis tool that signals what is known as a continuation pattern: an equity or currency’s price movement within a specific range after the trend falls or rises. The triangle pattern is used to identify whether the next move in the security is a breakout higher or a breakdown in pricing aligned with a bearish sentiment.
Traders versed in technical analysis use the triangle chart pattern to identify whether the current price movement of a stock or currency is bearish or bullish after substantial volatility and newfound upside or downside. As the triangle pattern forms, traders pause and analyze the signals to assess what may come next.
After range-bound trading, the price movement will often continue the same pattern. If it is an uptrend, it is known as a breakout. However, that pattern can fail, and the pricing trend can suddenly reverse. This is known as a pricing breakdown. Making trading decisions based on triangle patterns requires a nuanced understanding of the rules and knowledge of the different types of triangle patterns.
Understanding Triangle Patterns: What are the rules?
There are no rigid rules for interpreting triangle patterns. Instead, there are general guidelines that traders follow in identifying these patterns:
- Triangle patterns are often considered continuation patterns. In this case, triangles are used to identify breakouts for profitable trades. This consideration is especially true for smaller patterns and often presents the best trading opportunities.
- Conversely, larger patterns in triangles are considered both a continuation trend pattern and an indicator of a reversal trend.
- Breakout of patterns in either direction is often considered confirmed when accompanied by a healthy volume increase.
Type of Triangles
There are three types of triangle chart patterns:
- Ascending Triangle – this is a pricing pattern in which the equity is attempting to make multiple attempts at a new high, but none go above a certain threshold. One can draw a straight horizontal upper trendline across the price chart directly above all those highs. Simultaneously, as the price drops back down from that threshold, the low the price reaches is always higher than the last low that was set. One can draw a straight upward-sloping lower trendline across the price chart directly below all those lows.
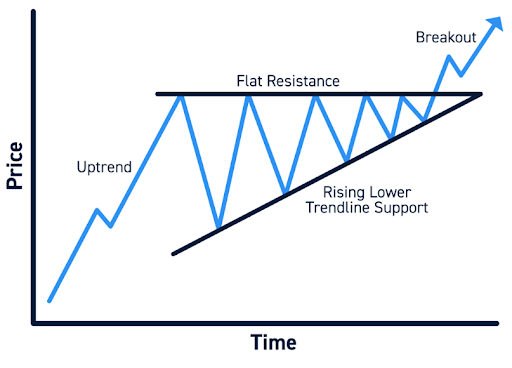
This pricing momentum indicates increasing confidence among buyers, slowly increasing their bids to place a rising floor on the price. This confidence-building transpires slowly and then suddenly as buyers detect the rising trend and race to buy at once to avoid missing out on the gains, manifesting a massive breakout higher in price.
- Descending Triangle – this triangle formation is the inverse of the ascending triangle. In this pricing pattern, the equity or currency makes lower highs at every attempt after an ongoing downward trend before the triangle formation. One can draw a straight downward-sloping trendline across the top of the chart.
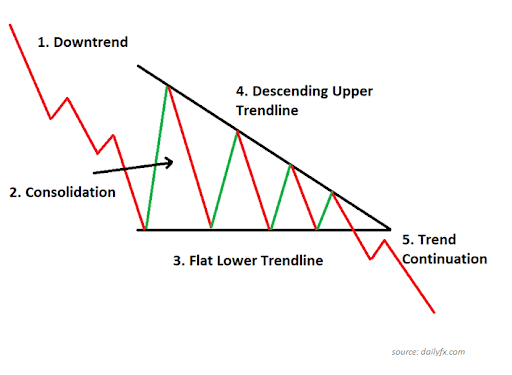
This is usually a result of buyers sensing an opportunity to bid after an ongoing downturn, slowly easing back into the trade. At this triangle formation, the pricing trend is usually unsustainable and often continues back towards the downward trend, breaching the lower trendline.
It is essential to note that this is not a certainty. There is a breakout strategy to be employed depending on market dynamics and bullishness. There may be a case for the trend to reverse and break out higher. Always pay attention to market conditions overall and the narratives driving those trends.
- Symmetrical Triangle – this is a unique triangle formation where the top and bottom trendlines converge to the middle towards one another. It is a tug of war between buyers and sellers where the highs are lower than the prior, and the lows are lower than the earlier lows.
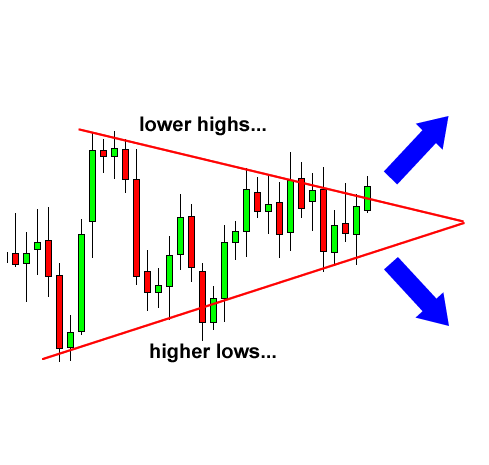
Symmetrical triangle patterns can be tricky as traders must carefully review for the potential of a breakout in prices to move higher or a breakdown of prices where the trend turns bearish. A symmetrical triangle pattern is not sufficient to independently guide pricing movement and must be used in tandem with other types of technical analysis.
| Triangle type | Upper trendline | Lower trendline | Bias | Most common breakout |
|---|---|---|---|---|
| Ascending | Flat (horizontal resistance) | Sloping up | Bullish | Above resistance |
| Descending | Sloping down | Flat (horizontal support) | Bearish | Below support |
| Symmetrical | Sloping down | Sloping up | Continuation of prior trend | In direction of prior trend |
How do you use triangle patterns in trading?
Traders can use several triangle formations as signals to find opportunities for breakouts and forecast future price moves:
- The trading opportunity in using triangle patterns is identifying breakouts, that is, when the price of a security exits a continuation pattern and pushes through an upper or lower threshold.
- A breakout higher allows traders to either go long the security or cover their shorts. A breakout lower is an opportunity for traders to open a short position or exit from their long positions.
- Volume confirms breakouts. It indicates that whatever is driving the price movement has broad appeal among traders.
- Breakouts from symmetrical triangles usually continue the same trend that the security was in before the triangle formed. So, if a stock had been on an upward price trend before entering a consolidation period forming the symmetrical triangle, more often than not, the breakout move would be higher for that stock.
Triangles are one of several continuation patterns worth knowing. The cup-and-handle pattern is another widely-used continuation setup that pairs well with triangle analysis when the broader trend is bullish.
What is the triangle breakout strategy?
The core aim of the triangle chart pattern is to determine a triangle breakout strategy. Traders gauge various triangles that form to determine the direction of the breakout, whether it will be an upper or lower threshold that will be breached from the continuation pattern that the price movement may currently be in.
Below are a few triangle breakout strategies to keep in mind:
- Breakouts accompanied by increased trading volume signify firm conviction among traders, and the breakout is most likely to be successful.
- Conversely, breakouts with low or no volume spikes are likely head fakes and prone to fail. Most breakouts correspond to news or activity around the security, leading to traders jumping into the trade, causing the volume to spike. Absent those spikes in volume, there is not sufficient news accompanying the move, thereby making it unlikely to be sustainable.
- It is essential to note that breakouts accompanied by volume spikes can sometimes fail as well, motivated primarily by short-term trading activity to lock in profits early. However, there are sufficient tactical traders in the market to often sustain the breakouts, given the conditions and activity behind the breakout.
- Most often, the successful breakout strategy is built on triangle patterns observed over several months. A sufficient timeframe is required to build out the equilibrium among buyers and sellers that eventually results in the breakout.
How to confirm a triangle breakout with volume
Most traders blow up triangle trades by entering on the first close beyond the trendline. The fix is volume. Inside the consolidation, volume should taper: each new touch of the upper or lower trendline prints lower volume than the touch before it. This volume contraction is similar to the coil seen in the volatility contraction pattern, where diminishing volume signals compression before a directional move. The breakout bar is the inverse: a volume spike meaningfully larger (typically 1.5x to 2x) than the average volume across the last 10 bars of the consolidation.
If the breakout candle does not have that volume spike, treat it as a probe, not a signal. Wait for either a retest of the trendline from the new side that holds, or a second close in the breakout direction with confirming volume. Skipping this step is the single biggest reason traders complain that triangle patterns do not work.
A simple checklist before entering:
- Volume contracted across the last 5 or more touches of the trendlines.
- Breakout bar volume is at least 1.5x the 10-bar consolidation average.
- Close (not just an intra-bar wick) is beyond the trendline.
- The break aligns with the trend that came in, unless you have a specific reason to fade it.
For volume overlay tools that pair well with this checklist, see our roundup of the best TradingView indicators.
Where to put the stop on a triangle trade
The cleanest stop on a triangle breakout sits on the other side of the trendline, plus a small buffer for noise. For an ascending triangle, that is below the upper horizontal resistance once it flips into support. For a descending triangle short, that is above the lower horizontal support once it flips into resistance. For a symmetrical triangle, the stop is on the other side of the apex.
The buffer matters. A clean break that closes 0.5% above resistance can wick 0.3% back through the line on the next bar without invalidating the setup. Set the stop somewhere between 0.3x and 0.5x ATR (average true range) past the trendline, not exactly on it.
This is also why position sizing matters more than entry skill on these trades. The stop distance changes with each setup. If you size every triangle trade the same dollar amount, your risk swings wildly. Size each triangle trade so that the distance from entry to stop is a fixed percent of your account, not a fixed dollar amount.
How to project the price target from the triangle’s height
This is the part most beginner guides skip. The classic price-target rule for triangles is the measured move: take the height of the triangle at its widest point (the vertical distance between the upper and lower trendlines at the start of the pattern), and add that distance to the breakout level for a long, or subtract it for a short.
Example: a symmetrical triangle that started 8 points wide breaks out at $52 to the upside. Target equals $52 plus 8, so $60.
Real charts rarely hit the measured-move target on the dot. Treat it as a scale-out zone, not a fixed exit. Many traders take partial profit at 0.5x the measured move and hold the rest with a trailing stop on the trendline that formed during the impulse leg. That is where logging the trade in a Financial Tech Wiz Trading Journal helps: across 20 or more triangle trades you can see whether your scale-out math actually beat just exiting at 0.5x for everything.
Want to track your triangle breakout trades without paying for software yet? The free Google Sheets template logs entry, stop, target, volume notes, and outcome so you can review your pattern hit rate after 20 trades.
Get the free templateConclusion
Triangle patterns work because they capture a market at equilibrium: price coils, volume contracts, and traders on both sides wait for the resolution. When the breakout finally comes, the rules are the same regardless of type: volume confirms it, the stop sits on the other side of the trendline, and the height of the pattern gives you a measured-move target.
Ascending triangles carry bullish bias. Descending triangles carry bearish bias. Symmetrical triangles defer to the trend that preceded them. But all three resolve through the same mechanism, and all three reward the same discipline: wait for volume, control your risk, and scale out at half the measured move.
No chart pattern works in isolation. Use triangles as one input alongside broader trend context, market conditions, and the news driving the security. The false-breakout rate rises sharply when traders chase every trendline break without filtering for volume and trend alignment.
For tracking whether your specific triangle setups are paying over time, log them in the Financial Tech Wiz Trading Journal and review your hit rate after 20 trades. For reversal signals at a trend’s end rather than continuation mid-trend, the head and shoulders pattern uses similar trendline logic to identify bearish breakdowns.
FAQ
Is the triangle pattern bullish or bearish?
Triangle patterns can resolve in either direction, but the bias depends on the type. An ascending triangle (flat top, rising bottom) is usually bullish because buyers keep paying up at higher lows while sellers cap the price at the same level. A descending triangle (falling top, flat bottom) is usually bearish for the inverse reason. A symmetrical triangle (both lines converging) tends to break in the direction of the trend that came in, but it has the highest false-breakout rate of the three.
What is the success rate of the triangle pattern?
Public data on triangle hit rates ranges roughly 60% to 65% when the breakout is volume-confirmed and aligned with the prior trend. The success rate drops sharply (closer to 45%) when you take every triangle break regardless of volume. The takeaway: most of the complaints that triangle patterns do not work are really volume-filter complaints.
What are the different types of triangles in Forex?
The three triangle types (ascending, descending, symmetrical) form in forex the same way they form in stocks, futures, and crypto. The difference in forex is context: currency pairs are heavily driven by macroeconomic news (rate decisions, inflation prints, geopolitical events), so triangles in forex break harder when they line up with a fundamental catalyst and fail more often during low-news ranges.
What is a triangle pattern in stocks?
A triangle pattern in stocks is a consolidation pattern where price coils inside two converging trendlines, signaling that buyers and sellers are reaching equilibrium before a directional resolution. Traders use the pattern to anticipate the breakout direction and project a price target using the height of the triangle.
How long does a triangle pattern take to form?
A triangle is usually considered valid after at least five touches of the trendlines (three on one line, two on the other). On a daily chart that typically translates to four to ten weeks. Tighter triangles (under three weeks) often resolve as failed continuations rather than clean breakouts because the consolidation has not had time to build up real positioning imbalance.
What timeframe works best for trading triangles?
Daily and 4-hour charts give the cleanest triangle signals because the consolidation has time to establish trendline integrity and volume contraction. Lower timeframes (5-minute, 15-minute) produce far more triangle-like shapes that turn out to be noise. If you trade intraday, look for triangles that form on the 1-hour or 4-hour and trade the breakout on a lower timeframe rather than identifying the pattern itself on the lower timeframe.
Can the triangle pattern fail?
Yes, and the failure modes are well-known: a low-volume breakout that reverses inside two bars (the head fake), a fast move past the trendline followed by a same-day close back inside the pattern (the failed retest), and a multi-week break that grinds sideways without reaching the measured-move target (the slow leak). The defense is the same in all three cases: do not enter without volume confirmation, set the stop on the other side of the trendline plus an ATR buffer, and scale out at half the measured move.
Get Your Free Trading Resources
Grab the free trading journal template plus the same tools we use to stay organized, consistent, and objective.
- Free trading journal template
- Custom indicators, watchlists, and scanners
- Access our free trading community
Enter your email below to get instant access.
No spam. Unsubscribe anytime.


