Auction Market Theory: A Trader’s Guide to Price Discovery (2026)
Auction market theory (AMT) is a framework that explains how price moves between buyers and sellers in any two-sided market. Traders use it to read whether the market is accepting a price range or rejecting it, which tells them whether to fade the move or join it.
At its core, AMT focuses on the continuous interactions between buyers and sellers, the imbalances that arise, and the price discovery that happens as the market searches for fair value.
One of the most widely traded imbalance concepts within the ICT framework is the fair value gap: a three-candle pattern that forms when price moves so aggressively that a gap appears between the first and third candle’s wicks. These zones frequently act as price magnets in the same way AMT describes imbalances drawing price back to areas of value.
Below you will find the definition, the three core building blocks (value area, point of control, TPOs), a step-by-step playbook, and a worked example you can apply on your next session.
Key Takeaways
- Imbalance between buyers and sellers drives price discovery; balance produces rotation near fair value.
- The value area (VAH, VAL) and point of control (POC) are the map of where the market has already agreed on price.
- Failed auctions at the edges of value are the highest-probability AMT setup because they trap late participants.
Recommended Tool
Financial Tech Wiz Trading Journal
Log your AMT trades, track value-area rotations vs failed-auction setups, and see which profile conditions actually make you money. Starting at $9.91/month billed annually.
Try It FreeWhat Is Auction Market Theory?
Auction market theory states that every market is a continuous two-sided auction: prices rise to attract sellers, fall to attract buyers, and stabilize where both sides agree trade is efficient. The framework was developed by J. Peter Steidlmayer at the Chicago Board of Trade in the early 1980s and refined in his 1986 book Markets and Market Logic. The lineage traces back further to Richard Wyckoff’s early work on accumulation and distribution in the 1920s and 30s (see our list of classic technical analysis literature).
At the heart of AMT lies the imbalance between buyer and seller aggression. These imbalances arise from news, positioning, and macro shifts that push participants to act. As a result, price moves directionally until a new area of agreement emerges.
- Fair value: the price area where trade is facilitated most efficiently. Buyer and seller aggression are closely balanced, so trade stays within a relatively tight range.
- Imbalanced markets: one side dominates. Price moves directionally and the market enters a discovery phase searching for a new value area.
- Balanced markets: equilibrium. Prices rotate near fair value and volume is steady.
The Building Blocks: Value Area, Point of Control, and TPOs
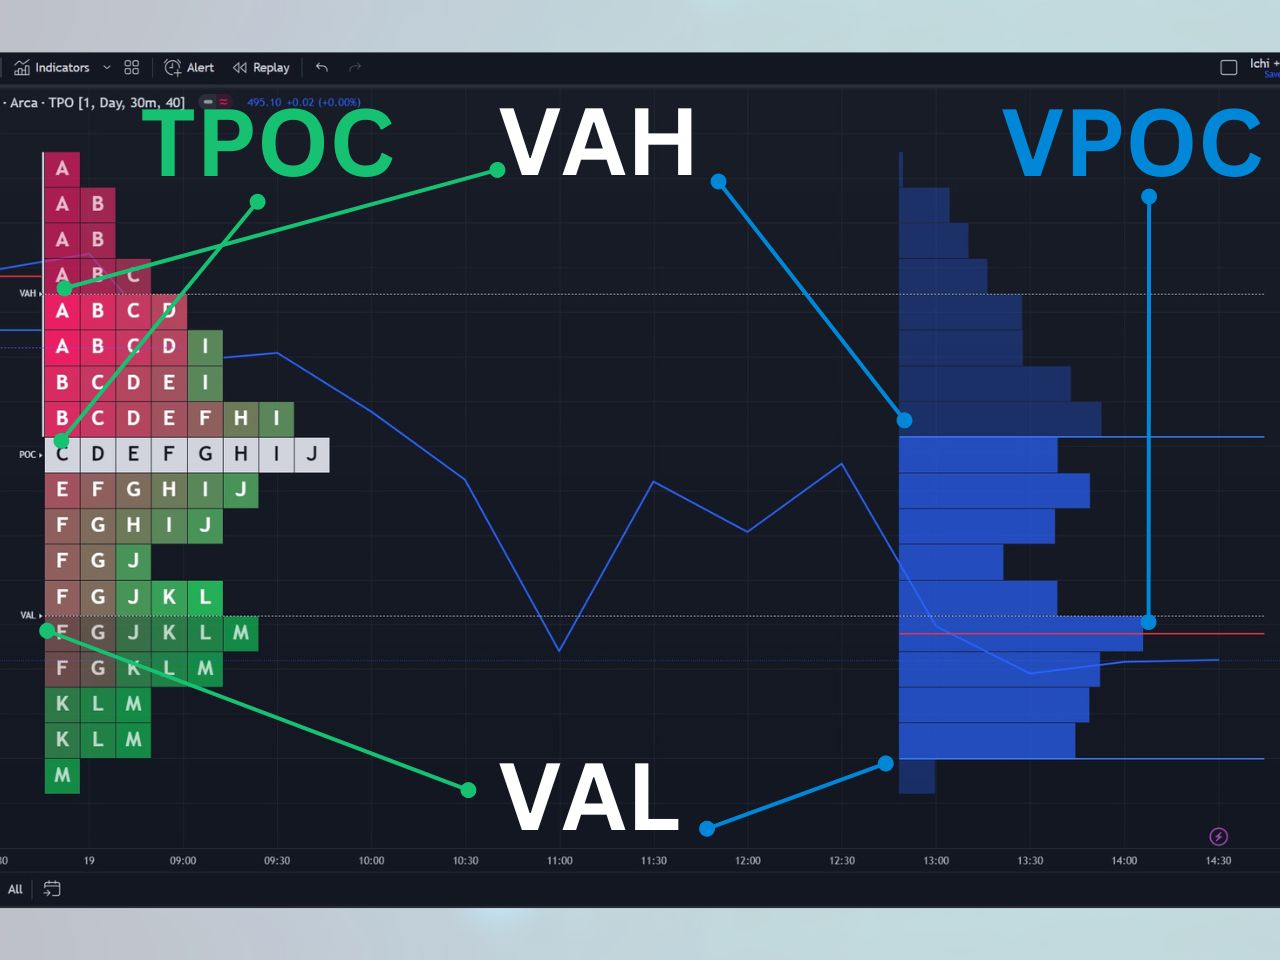
The value area is the price range where roughly 70% of a session’s trading activity occurred, bounded by the Value Area High (VAH) on top and the Value Area Low (VAL) on the bottom. It represents the one-standard-deviation zone around fair value for that session.
The point of control (POC) is the single price level with the most trading activity during the session. It is the magnet on the profile. Price tends to return to the POC during balanced days because it represents the location where the most buyers and sellers agreed on value.
A time-price opportunity (TPO) is the building block of the profile itself. Each TPO represents a fixed block of time (often 30 minutes) at a given price. Stack enough TPOs and you see the distribution: thick where price accepted value, thin where price rejected it. Tools like the anchored VWAP pair well with value-area analysis because both answer the same question from different angles: where is the market’s accepted average price?
High Volume Nodes vs Low Volume Nodes
A high volume node (HVN) is a price level on the profile where a lot of trading happened. It represents acceptance. When price returns to an HVN, expect rotation and reaction; this is where support and resistance live on the profile.
A low volume node (LVN) is the opposite. Thin trading on the profile means price passed through quickly without finding acceptance. When price revisits an LVN, expect a fast move through with little resistance, which is why many breakout traders use LVNs as continuation signals. For a deeper look at order flow inside these zones, see how footprint charts visualize the actual buy and sell prints at each price.
Market Profile: Visualizing the Auction
To visualize the auction, traders turn to a charting tool called Market Profile. Developed by Peter Steidlmayer in the early 1980s, Market Profile plots price distribution over time and surfaces the value area, POC, and overall profile shape.
Market Profile is based on the concept of Time-Price Opportunity (TPO) and comprises three fundamental components: price, time, and volume. The result is a visual representation of the market’s auction process that reveals patterns of herd behavior and the ebb and flow of price.
How to Trade Auction Market Theory Step by Step
AMT becomes actionable when you turn the framework into a repeatable pre-market routine. Here is the step-by-step approach:
- Identify yesterday’s value area (VAH, VAL) and POC. These become today’s primary reference levels.
- Classify today’s open relative to yesterday’s value: open inside value (rotation day likely), open above value (bullish drive candidate), or open below value (bearish drive candidate).
- Watch for acceptance or rejection at the nearest HVN or LVN. Acceptance means multiple TPOs print at the level. Rejection means one or two quick TPOs and reversal.
- Wait for a failed auction at an edge for the highest-probability reversal. This is covered in detail in the next section.
- Manage risk with a stop beyond the rejected edge, not at a round number. Your stop lives where your thesis is invalidated.
- Log the trade and review the profile shape after close. You can track this with the free trading journal template or in the Financial Tech Wiz Trading Journal for automated analytics on your AMT setups over time.
Failed Auctions: The Highest-Probability AMT Setup
A failed auction happens when price attempts to break out of the value area, fails to find acceptance beyond the edge, and reverses back inside value. On the profile, it looks like a single-print tail that price immediately rejects.
Failed auctions are high probability because they trap participants. Breakout traders who entered on the poke above VAH now sit at a loss, and their stop-outs fuel the move back toward POC. The same mechanic works symmetrically below VAL. The setup is cleanest when the failed auction occurs on low relative volume, because it signals the breakout attempt lacked conviction.
The practical trade: short the rejection back below VAH with a stop above the session high, targeting the POC first and then VAL. Long side mirrors: buy the rejection back above VAL with a stop below the session low, targeting POC then VAH.
A Worked Example: AMT on a Trading Day
Assume the S&P 500 futures (ES) or SPY closed yesterday with VAH at 5,820, POC at 5,810, and VAL at 5,800. Today’s open prints at 5,812, inside yesterday’s value area. Step one: this is a rotation-day setup.
Price drifts down to 5,806, touches the HVN just above VAL, and rotates back to POC at 5,810. This is acceptance at the HVN. Later, price pokes above VAH to 5,823, fails to attract follow-through volume, and immediately prints back below 5,820. That is a textbook failed auction at the upper edge.
The short trigger fires on the re-entry below 5,820. Stop sits above the session high at 5,824. First target is POC at 5,810 (typical). Second target is VAL at 5,800 if the rotation develops into a full range excursion. The trade risks 4 points to make 10 to 20, which is the exact reward-to-risk profile AMT is built to produce.
Auction Market Theory vs Efficient Market Hypothesis
The efficient market hypothesis (EMH) argues that prices already reflect all available information, so finding an edge is effectively impossible. Auction market theory argues the opposite: prices are constantly rediscovering value as new information and inventory imbalances force the auction forward.
Both frameworks can be true at different timeframes. EMH describes long-horizon equilibrium; AMT describes the intraday and swing process by which that equilibrium is continuously re-established. For traders working on hourly and daily charts, AMT is the more useful lens because it tells you where the market currently disagrees with itself, which is where the trades live.
Key Applications of AMT in Trading
Armed with the framework, traders can apply AMT in three main ways:
- Mean reversion in balanced markets: fade moves away from fair value and play the return to POC.
- Trend trading in imbalanced markets: trade in the direction of the imbalance during the discovery phase, using VAH or VAL as breakout trigger levels.
- Volume and order-flow confirmation: use Volume Profile alongside AMT to confirm which price levels absorbed real size versus which were tested on thin liquidity.
Leveraging Market Profile and Volume Profile on TradingView
For traders applying AMT, TradingView offers two complementary tools for visualizing and analyzing market auctions: Market Profile and Volume Profile. These tools surface the price distribution and volume distribution of the session so you can identify value area, POC, HVN, and LVN without doing the math yourself.
Market Profile plots price distribution over time, making acceptance and rejection visible at a glance. Volume Profile plots the volume distribution at each price level, making HVN and LVN obvious. Used together, they cover both the time and volume halves of the auction story.
TradingView also hosts a custom Market Profile indicator by RunStrat (RS: Market Profile), which marks the POC, calculates the value area, and plots VWAP alongside the profile. It is one of the better free indicators for daily AMT analysis.
To use Market Profile and Volume Profile at scale, you need a TradingView premium plan. New users can typically access a 30-day free trial of TradingView premium through this link, which also includes a discount on the first paid month.
Exclusive Deal: 30-Day FREE Premium Access + Bonus Credit
Get Market Profile and Volume Profile at full resolution
- Market Profile & Volume Profile
- Real-Time Data
- Track all Markets
Frequently Asked Questions
Who created auction market theory?
Peter Steidlmayer created auction market theory at the Chicago Board of Trade in the early 1980s and formalized it in his 1986 book Markets and Market Logic. Jim Dalton later popularized Market Profile and AMT for retail traders through books such as Mind Over Markets. The conceptual lineage also traces back to Richard Wyckoff’s early 20th-century work on accumulation and distribution.
What is an auction market in simple terms?
An auction market is a market where buyers and sellers compete by placing bids and offers, and price is determined by the continuous interaction between them. Stock exchanges, futures exchanges, and most crypto exchanges are auction markets because every trade clears at a price both sides agreed on.
What is the value area in auction market theory?
The value area is the price range where roughly 70% of a session’s trading activity occurred. It is bounded by the Value Area High (VAH) at the top and the Value Area Low (VAL) at the bottom, with the Point of Control (POC) somewhere inside. The value area represents the one-standard-deviation zone around fair value for that session.
What is the difference between Value Area High and Point of Control?
The Value Area High (VAH) is the upper edge of the session’s value area (where price found acceptance for 70% of the time). The Point of Control (POC) is the single price level inside the value area where the most trading volume occurred. VAH marks the top of fair value; POC marks the magnet within it. Traders typically fade a VAH rejection toward POC as a first target.
What are examples of auction theory?
Auction theory applies to any situation where resources are allocated through bidding. Common examples include:
- Spectrum auctions, where governments sell licenses to use radio frequencies.
- Treasury auctions, where governments sell bonds to finance budget deficits.
- Art auctions, where collectors bid for paintings or sculptures.
- Charity auctions, where donors bid for items to raise money for a cause.
- Online auctions on platforms such as eBay.
How do you trade auction market theory?
To trade auction market theory, start by identifying yesterday’s VAH, VAL, and POC, then classify today’s open relative to that value area. Watch for acceptance or rejection at HVNs and LVNs, and wait for a failed auction at an edge for the highest-probability reversal. Manage risk with a stop just beyond the rejected edge and target POC first, then the opposite edge if rotation develops. Market Profile and Volume Profile are the two charting tools that make this workflow visible.
Does auction market theory work for stocks, options, and crypto?
Yes, AMT works on any market with a continuous two-sided auction, which includes futures, equities, and most major crypto pairs. Options are derivatives, so AMT is applied to the underlying asset rather than the options themselves. For 24-hour markets like crypto, you need to define your session boundaries explicitly (for example, UTC day or the CME futures session overlap) because the profile resets differently than it does for a 9:30 to 4:00 equity session.
What are the different types of auction game theory?
Auction game theory studies how bidders strategize in different auction formats:
- First-price sealed-bid auctions: bidders submit bids secretly; highest bidder wins and pays their bid.
- Second-price sealed-bid auctions (Vickrey): highest bidder wins but pays the second-highest bid.
- English auctions (open ascending): bidders openly raise bids until no one bids higher.
- Dutch auctions (open descending): the seller starts high and lowers the price until a bidder accepts.
- All-pay auctions: bidders pay their bids whether they win or not.
What is auction theory and what are its applications?
Auction theory is an applied branch of economics that analyzes how bidders act in auction markets and how auction rules shape outcomes. It is used to design efficient mechanisms for allocating scarce resources such as spectrum licenses, electricity contracts, and carbon permits; to evaluate the performance of different auction formats; and to develop bidding strategies for complex multi-round auctions.
What is TPO auction theory?
TPO stands for Time-Price Opportunity, the building block of a Market Profile chart. Each TPO represents a fixed block of time (typically 30 minutes) at a specific price. The stack of TPOs at each price level creates the profile shape, which shows where the market spent time (value area, POC) and where it moved quickly (single prints, LVNs). TPOs turn the continuous auction into a visual distribution a trader can read at a glance.
Get Your Free Trading Resources
Grab the free trading journal template plus the same tools we use to stay organized, consistent, and objective.
- Free trading journal template
- Custom indicators, watchlists, and scanners
- Access our free trading community
Enter your email below to get instant access.
No spam. Unsubscribe anytime.


