The Best Indicators for Options Trading
Learn how technical analysis can benefit your options trading.
Magic options trading chart indicators do NOT exist
Technical analysis for options trading is a somewhat controversial topic, as many hedge funds have proved that it is tough to time the market accurately.
There are no magic indicators out there that will be able to give you perfect buy and sell signals consistently. However, this does not mean there is no merit in studying options trading chart indicators.
There is a wide range of technical indicators, such as moving averages, volume profile, fibonacci retracements, pivot points, and much more.
Technical analysis provides context for options trading
To become a successful options trader, you are not required to learn any of this, but technical indicators can be a great way to provide context to what is happening in the market.
If you simply look at a candle chart of two different stocks with no indicators, it could be challenging to determine how the market is pricing these stocks.
Keep it simple
Using a common indicator such as the 200-day moving average, you can compare different stocks based on this line alone.
Let’s say you notice a stock index like the Nasdaq is trading below its 200-day moving average and an oil ETF is trading above its 200-day moving average.
You can conclude that stocks are not doing as well as oil, providing that context.
If you are looking for universal charting software, I highly recommend Tradingview. Since Tradingview is not tied to a specific broker, you can always rely on it if you decide to switch brokers. You can try Tradingview out for 30 days free with my affiliate link.
When you use my affiliate link to sign up for TradingView, you can get a referral credit and a 30-day free trial of the premium features!
Get a TradingView Referral Credit & Free Trial
Best Indicators for Options Trading
1- Moving Averages
There are two types of moving averages: a simple moving average (SMA) and the exponential moving average (EMA). They are one of the best indicators for options trading because they provide support and resistance levels.
Both require a length input, which determines how far back in time the indicator covers. One of the most common SMAs used is the 200 SMA on a daily timeframe.
When a 200 SMA line is plotted on a daily chart (each candle represents one day), this is also known as the 200-day moving average.
When a stock is trading above this 200-day moving average, it is considered to be in an uptrend; if it is trading below this line, the stock is generally considered to be down trending.
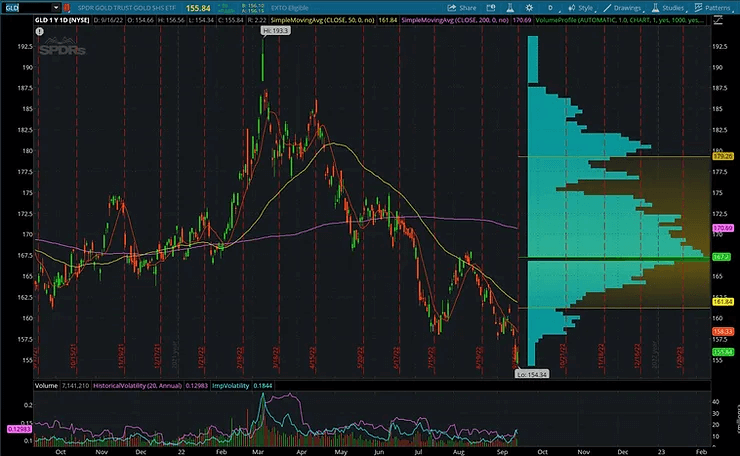
2- Volume Profile
The volume profile is not as well-known as other indicators, but it is one of the best indicators for options trading.
Usually, we can view the amount of volume traded on a stock per day as a vertical bar. This is great, but it does not tell us what price the most volume was occurring at.
The volume profile will show you volume by price and is plotted horizontally on the chart.
You will notice that there is a lot more volume occurring at certain prices than others.
This price is known as a high volume node or an area of value. It is the price in which shares have traded hands most times, so it is viewed as an area of value to both the buyers and the sellers.
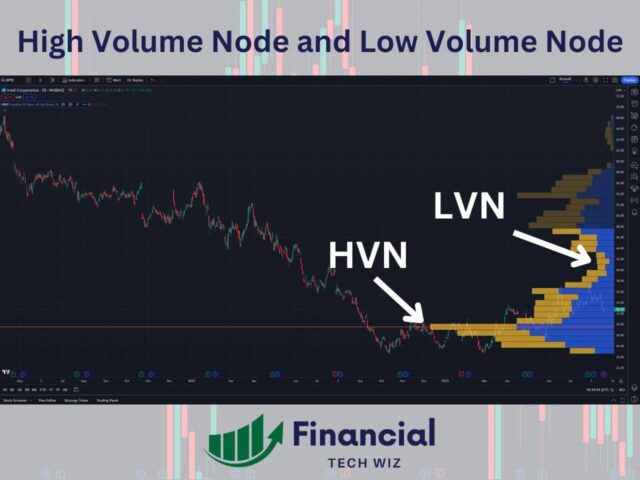
From this information, we can gather that these high-value areas are where most people’s cost basis will be, whether short or long.
The price of a stock generally tends to revert to these points of value often, so people often try to fade the extremes of the value area.
For example, when the price falls below the high volume area to another area with a lower volume, they will buy here to fade the shorts and attempt to ride the shares back up to the value area. This is just one strategy, and this indicator has many nuances. The best platform to utilize the volume profile is TradingView, but you can also use it on the thinkorswim platform.
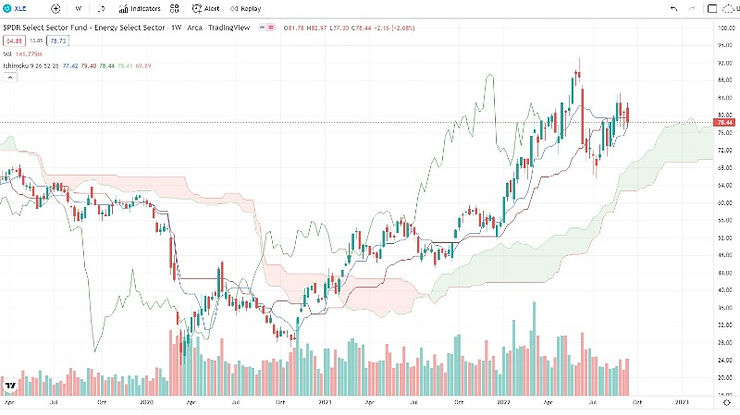
3- Ichimoku Cloud
Ichimoku cloud trading strategies rely on stocks to be trending up or down. The Ichimoku cloud will be green when a stock is trending up, as you can see in the chart of $XLE below.
When the conversion line crosses over the tenkan-sen line, this is called a TK-crossover, and it is a buy signal. This happened on the weekly chart of $XLE in October, above a green cloud, indicating a strong buy.
Technical Analysis for Options Trading: Bottom Line
Trading with technical analysis should come second to developing an options strategy that is expected to have a positive expectancy in the long run.
It can be advantageous to find areas of value and determine that one price might be a better spot to buy than another. Still, this can become useless information without a strategy to manage your risk and take profits.
What I mean by this is that support levels are only valid until they are broken, and you are left with an unrealized loss. One way to combine technical analysis with an options strategy is to go long at support areas and set a stop loss below this area in case it breaks.
If you put the risk to reward in your favor each time and have a strategy of where to cut losses and take profits, then technical analysis can be a fantastic tool to improve your win rate and profitability.
Related Resources
Get Your Free Trading Resources
Grab the free trading journal template plus the same tools we use to stay organized, consistent, and objective.
- Free trading journal template
- Custom indicators, watchlists, and scanners
- Access our free trading community
Enter your email below to get instant access.
No spam. Unsubscribe anytime.


