The Long-Legged Doji Candlestick Pattern Explained
Candlestick patterns provide valuable insights into market sentiment and potential trend reversals. One such pattern is the Long-Legged Doji.
This article will explore the characteristics, interpretation, and trading strategies associated with this candlestick pattern. The charts used are from TradingView, an excellent choice for performing technical analysis.
Long-Legged Doji Candle Meaning
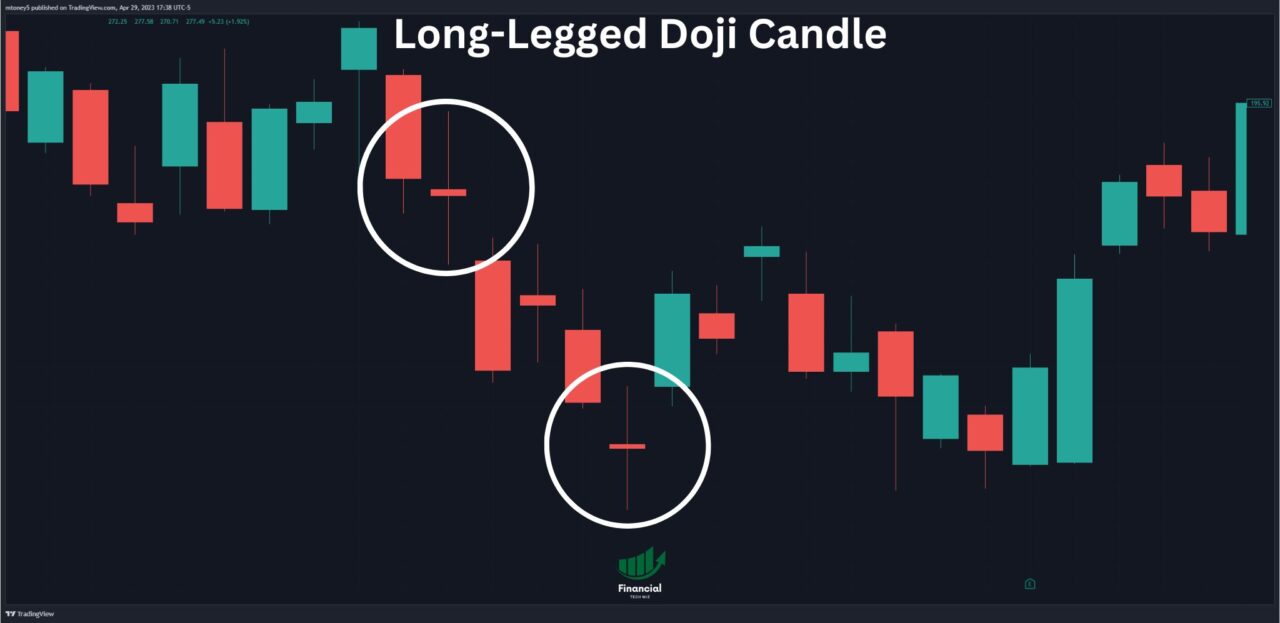
The Long-Legged Doji is a candlestick pattern that exhibits the following characteristics:
- It is formed by a doji candle with opening and closing prices that are the same or similar.
- The upper and lower shadows of the candle are significantly longer than the body.
- The body of the candle is located in the middle or near the mid-range of the candle.
Interpretation of the Long-Legged Doji
As with other doji candles, the Long-Legged Doji is generally considered a neutral pattern. However, its interpretation can vary depending on the market context:
- Reversal Signal: When the Long-Legged Doji occurs after a long white candle, it can indicate a potential trend reversal. Traders commonly consider taking positions in line with the opening of the subsequent candle.
- Market Sentiment: The rapid growth and decline represented by the long upper and lower shadows reflect considerable concern among traders. This momentary euphoria, followed by quick reversals, suggests market indecision and can be a precursor to significant price movements.

Long-Legged Doji Trading Strategies and Tips
Incorporating the Long-Legged Doji into your trading strategies requires careful analysis and consideration. Here are some tips to keep in mind:
- Confirmation: While the Long-Legged Doji itself provides valuable information, it is essential to confirm the pattern with other technical indicators or candlestick patterns before making trading decisions.
- Market Context: Analyzing the market context before and after the Long-Legged Doji is crucial. Look for supportive factors such as trendlines, support or resistance levels, or other patterns that align with the potential reversal signal.
- Risk Management: Implement proper risk management techniques, including setting stop-loss orders and determining profit targets, to protect your capital.
Related Doji Candlestick Patterns
Exploring other doji candlestick patterns can enhance your understanding of these reversal signals. Here are some related patterns worth exploring:
- Double Doji Candle Pattern: This pattern involves two consecutive doji candles and can indicate significant indecision in the market.
- Evening Doji Star Pattern: This bearish reversal pattern consists of a long white candle, a small doji or spinning top, and a long black candle.
- Different Types of Doji Candles: Learn about various types of doji candles and their specific characteristics.
- Dragonfly Doji Candlestick: This pattern has a long lower shadow and a small or nonexistent upper shadow, indicating potential bullish reversals.
- Gravestone Doji: The Gravestone Doji has a long upper shadow and a small or nonexistent lower shadow, signaling potential bearish reversals.
Long-Legged Doji Candlestick | Bottom Line
The Long-Legged Doji Candle is a significant candlestick pattern that provides valuable insights into market indecision and potential trend reversals. By understanding its characteristics and interpreting it in the right market context, traders can make informed trading decisions.
Remember to combine the Long-Legged Doji pattern with other technical indicators and perform thorough analysis before making trading decisions. Risk management should always be a priority to protect your capital.
Additionally, exploring related doji candlestick patterns, such as the Double Doji Candle Pattern, Evening Doji Star Pattern, Different Types of Doji Candles, Dragonfly Doji Candlestick, and Gravestone Doji, can further enhance your understanding of reversal signals and expand your trading strategies.
Additionally, consider TradingView charts to spot technical patterns with ease.
This article contains affiliate links I may be compensated for if you click them.
Get Your Free Trading Resources
Grab the free trading journal template plus the same tools we use to stay organized, consistent, and objective.
- Free trading journal template
- Custom indicators, watchlists, and scanners
- Access our free trading community
Enter your email below to get instant access.
No spam. Unsubscribe anytime.


