How To Add & Use the Tradingview RSI Indicator
This guide will walk you through the process of adding and customizing the RSI indicator on TradingView, a leading platform for market analysis.

How to Add RSI to Your TradingView Charts
If you’re not yet a TradingView user, you might want to start with their free trial if it’s available. Once you’re signed in, follow these steps to add the RSI to your charts:
- Open the chart you want to add the RSI indicator to.
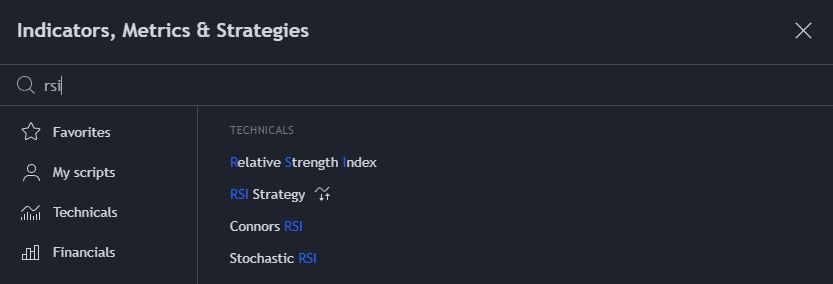
- Click on the “Indicators” button located at the top of the chart, or right-click on the chart and select “Add Indicator.”
- In the search bar, type “RSI” and select the “Relative Strength Index (RSI)” from the list of available indicators.
Customizing RSI Settings on TradingView
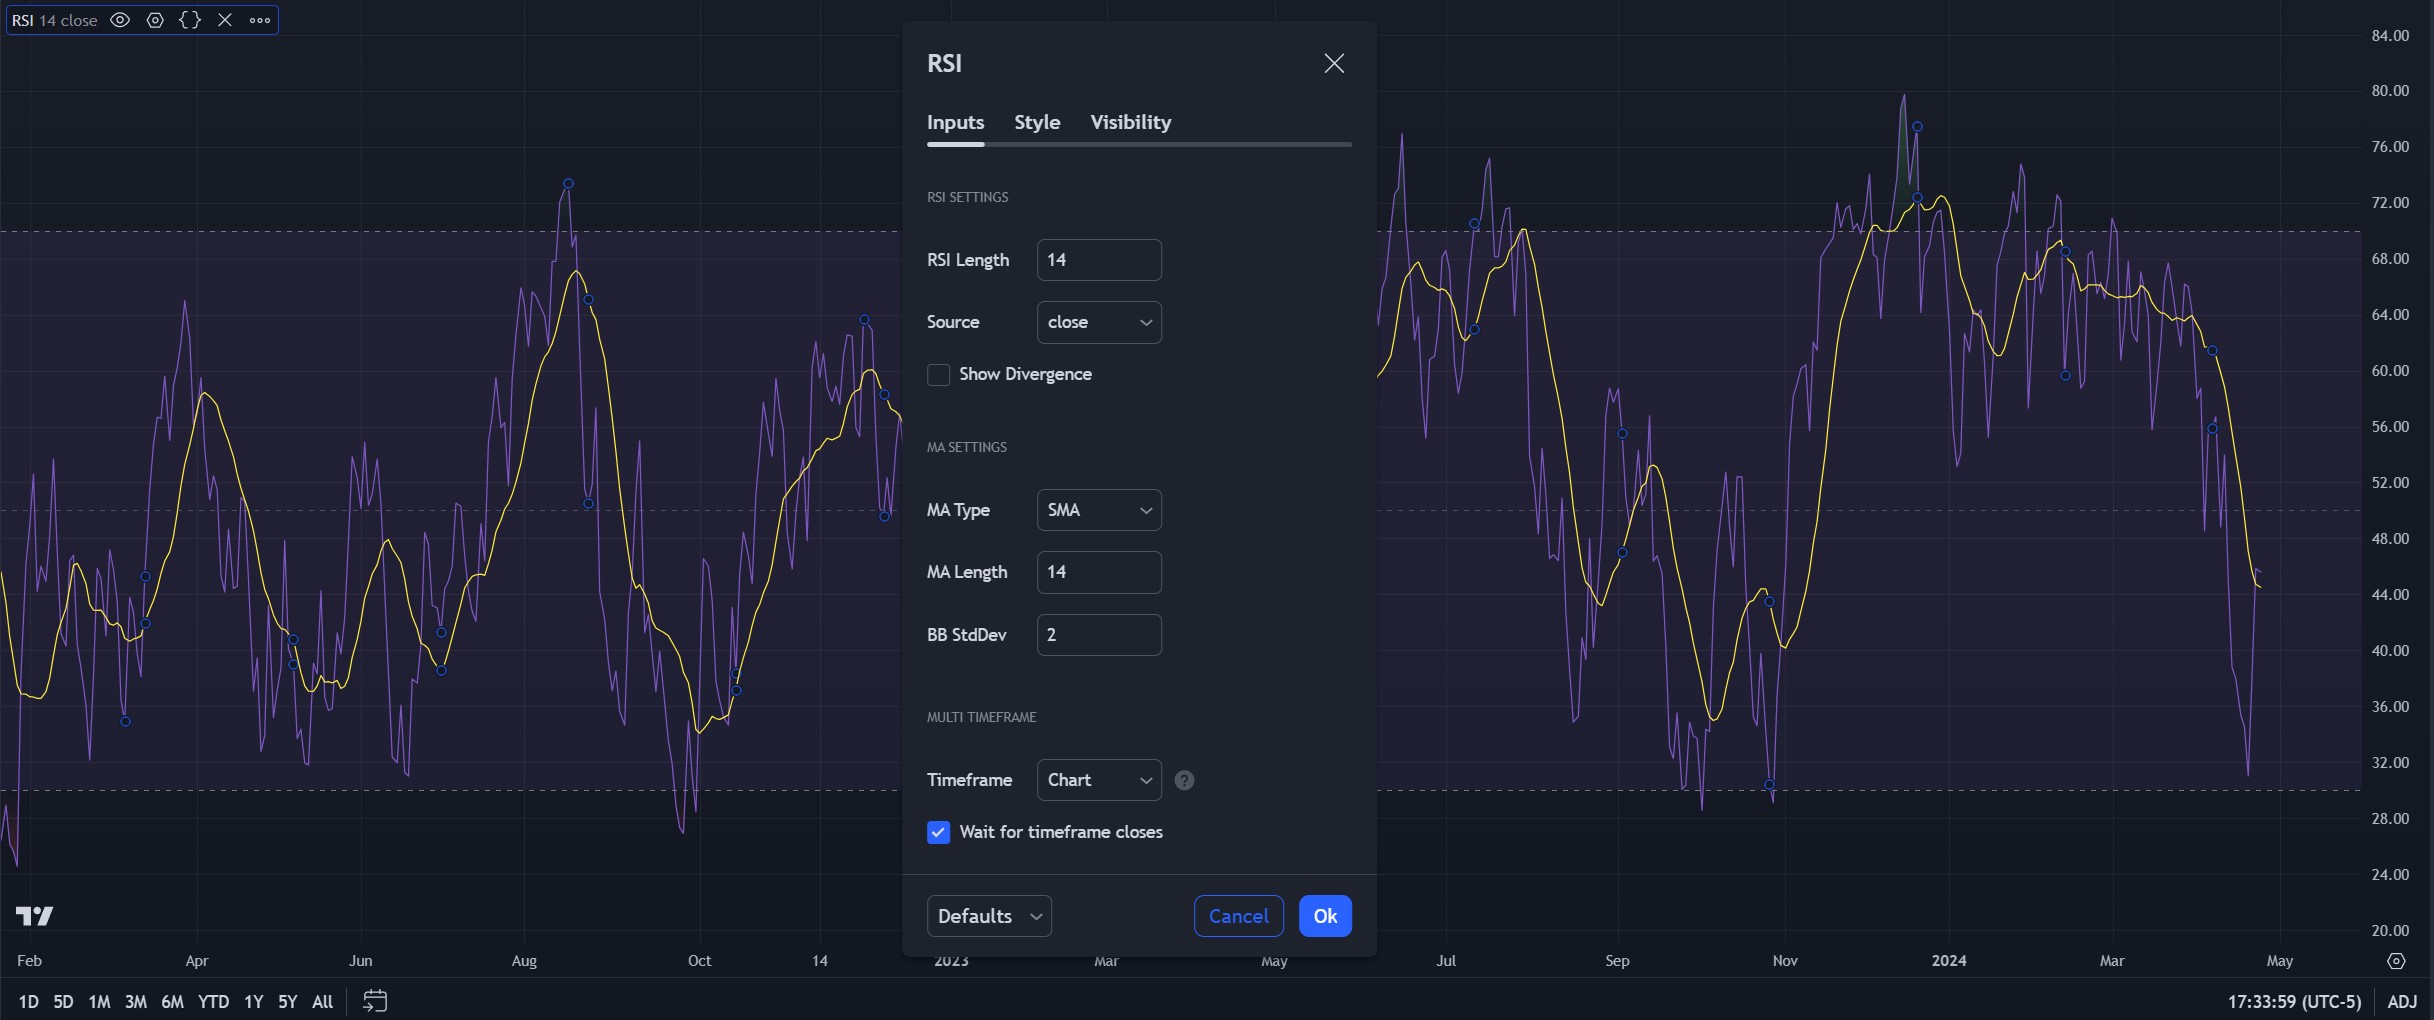
After you’ve added the RSI to your chart, you can customize its settings and the RSI MA (moving average) settings. By default, each length is set at 14, which is commonly used.
A longer length will account for more than 14 periods and give you data with a longer-term outlook. A shorter RSI length will give you data about only recent price movement. Adjust these according to your preferences, and click the “OK” button to confirm your changes.
When you use my affiliate link to sign up for TradingView, you can get a referral credit and a 30-day free trial of the premium features!
Get a TradingView Referral Credit & Free Trial
What Time Frame is Best for the RSI on TradingView?
Swing traders commonly use the RSI on the daily time frame, but you can technically use it on any. Day traders may prefer to use it on the one, five, or 30-minute time frame.
How to Read the RSI Indicator
The RSI, developed by J. Welles Wilder, is a momentum-based oscillator that measures the speed and change of price movements. Ranging between 0 to 100, it is typically used to identify ‘overbought’ and ‘oversold’ conditions.
Identifying Overbought & Oversold Conditions With the RSI
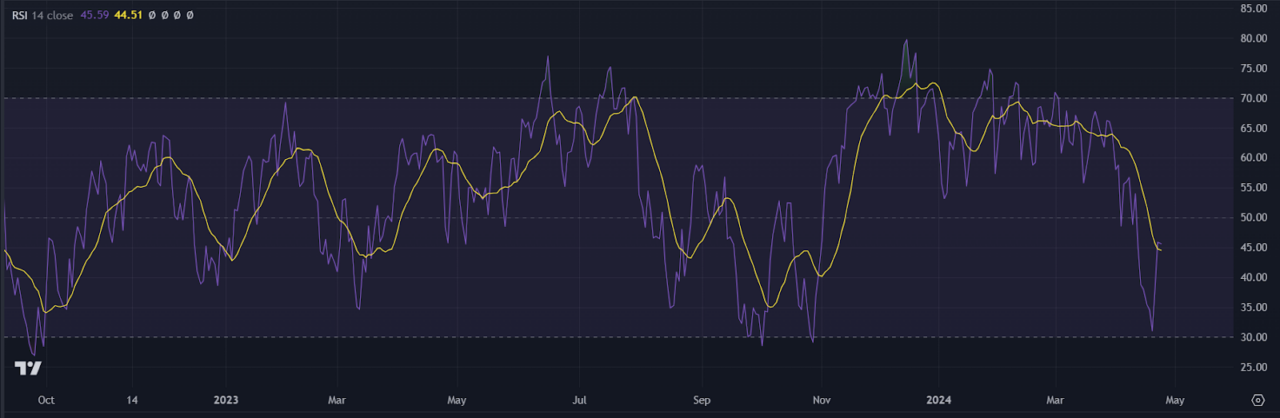
An RSI above 70 indicates an overbought condition, suggesting a potential reversal or corrective move. Conversely, an RSI below 30 indicates an oversold condition, suggesting a potential upward price movement.
TradingView makes it easy to see since a purple box highlights the range between 30 and 70. If the RSI is above the box, the asset is in oversold territory, and vice versa when it is under the box.
Using the RSI Moving Average (MA) on TradingView
When you add the RSI indicator to TradingView, you will notice an MA plotted with it, which can help you determine trend shifts. The RSI MA is designed to smooth out the RSI line and help you get a better feel for momentum. When the RSI crosses over this MA, there is a potential shift in momentum to the upside.
You can customize the MA to be an SMA or an EMA, depending on your trading style. An SMA is best for swing trading, while an EMA puts more weight on recent price movements, making it best for day trading. To learn more about how these moving averages are calculated, you can read my article comparing EMAs vs. SMAs vs. MAs. vs. WMAs.
Combining the RSI With Other Indicators
The RSI is a relatively simple indicator, and it works best when combined with other TradingView indicators like the Ichimoku clouds, volume profile, or Fibonacci retracements.
For example, if the RSI is over 70, indicating an asset is overbought, consider drawing some Fibonacci retracements to see if there is any additional resistance. You can also look for high-volume nodes above the current assets on the volume profile to determine resistance levels and confirm the RSI reading.
If you are a day trader, you may use an indicator like the VWAP with the RSI to help determine price targets. For example, if the RSI reading is over 70, it is probably trading much higher than the VWAP, given you are using a shorter time frame like the 5-minute. Therefore, you can short the asset and use the VWAP as your profit-taking level.
Perfecting Your Strategy With the RSI on TradingView
The RSI is a versatile tool that can greatly enhance your trading strategy on TradingView. By understanding how to add and customize it, you can fine-tune your approach to suit your trading style.If you aren’t already, sign up for a free TradingView account and take your technical analysis to the next level. I believe it is the best charting software for stocks and is completely free to use most features.
When you use my affiliate link to sign up for TradingView, you can get a referral credit and a 30-day free trial of the premium features!
Get a TradingView Referral Credit & Free Trial
Get Your Free Trading Resources
Grab the free trading journal template plus the same tools we use to stay organized, consistent, and objective.
- Free trading journal template
- Custom indicators, watchlists, and scanners
- Access our free trading community
Enter your email below to get instant access.
No spam. Unsubscribe anytime.


