TradingView vs. Stockcharts | Which is Better?
Today we will take a look at TradingView and Stockcharts – two of the biggest charting platforms on the market today.
In this post, we discuss their key components and compare their upsides and downsides, and show you why they are two of the best charting software for stocks.
| Platform | Charts per Layout | Backtesting | Alerts | Screeners | Assets and Markets |
|---|---|---|---|---|---|
| TradingView Free Trial | 2 (Essential), 4 (Plus), 8 (Premium) | Yes | 20 (Essential), 100 (Plus), 400 (Premium) | Yes | Stocks, Forex, Crypto, Futures, Options, Bonds, ETFs, CFDs, Indices, Commodities |
| StockCharts Visit site | 1 (Basic), 25 (Extra, Pro) | No | 2 (Basic), 200 (Extra), 500 (Pro) | Yes | Stocks, ETFs, Mutual Funds, Indices |
Interface and Chart Design
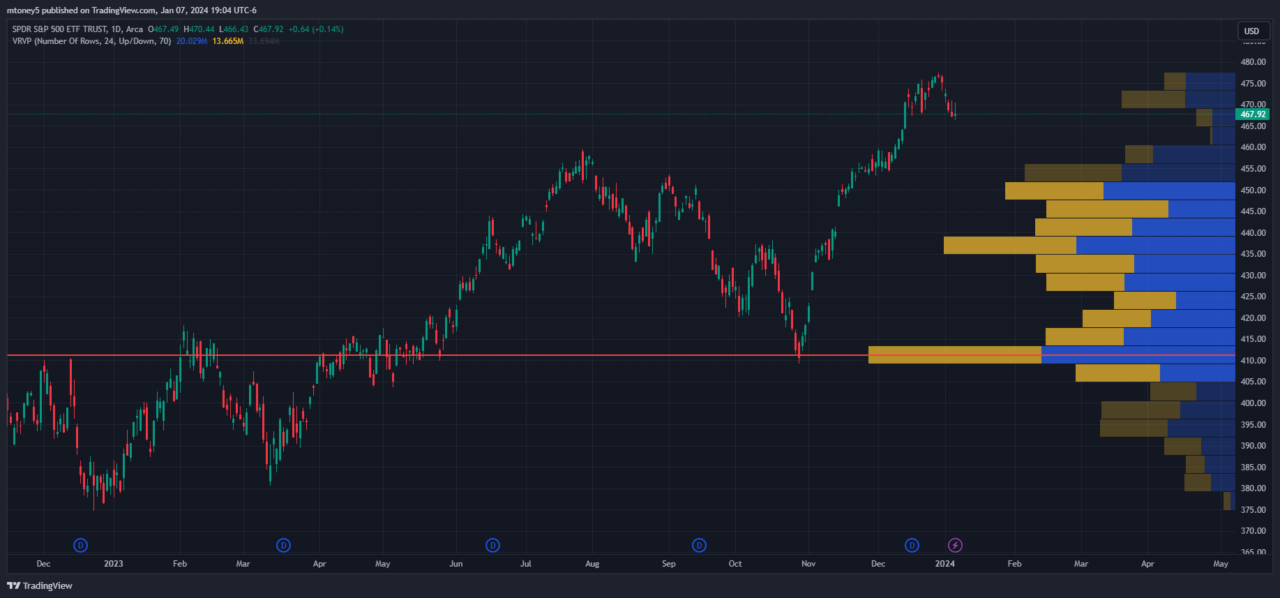
TradingView and Stockcharts both provide a modern-looking and intuitive interface.
TradingView offers a modern, smart, and highly intuitive interface alongside a dashboard that displays all relevant panels (Watchlist, News, Market Summary). TradingView also provides an incredible user-friendly charting experience powered by HTML 5.
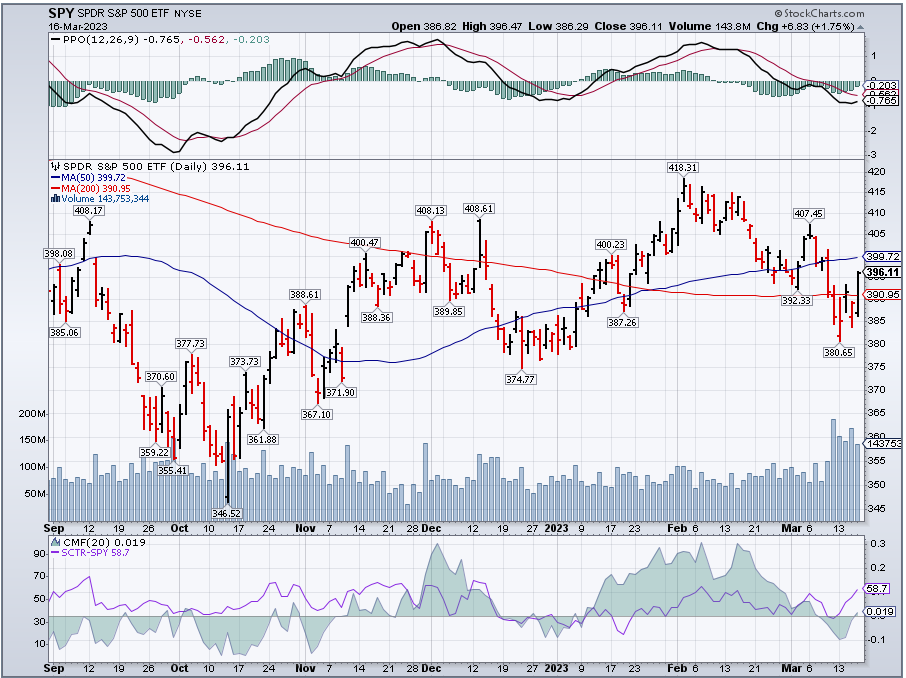
On the other hand, StockCharts emphasizes expert market analysis and commentary, making it a valuable resource for those looking to learn from industry professionals.
In terms of customization, both platforms provide ample options for personalizing charts and indicators. However, TradingView has a slight edge with its Pine Script language, allowing users to create custom studies and strategies.
Pricing
TradingView is cheaper than Stockcharts, but both have a fairly wide selection of plans for customers to choose from suitable to their budget.
| Platform | Free | Essential | Plus | Premium |
|---|---|---|---|---|
| TradingView Free Trial | Yes | $14.95/month | $29.95/month | $59.95/month |
| StockCharts Visit site | Yes | $19.95/month | $29.95/month | $49.95/month |
TradingView Plans
TradingView offers three different annual subscription plans:
- Essential – $12.95 per month (billed annually)
- Plus – $24.95 per month (billed annually)
- Premium – $49.95 per month (billed annually)
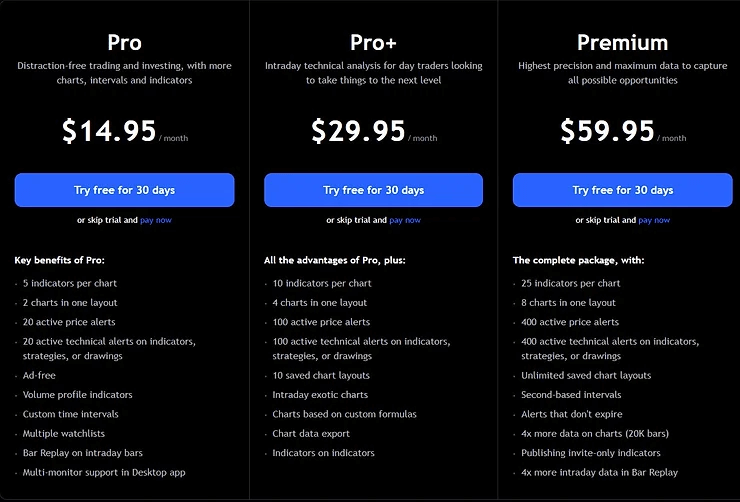
Monthly rates are also available for a slightly higher price:
- Essential monthly: $14.95
- Plus monthly: $29.95
- Premium monthly: $59.95
TradingView Limited Time Offer!
Exclusive Deal: 30-Day FREE Premium Access + Bonus Credit
Don’t Miss Out – Sign up for TradingView Now!
- Advanced Charts
- Real-Time Data
- Track all Markets
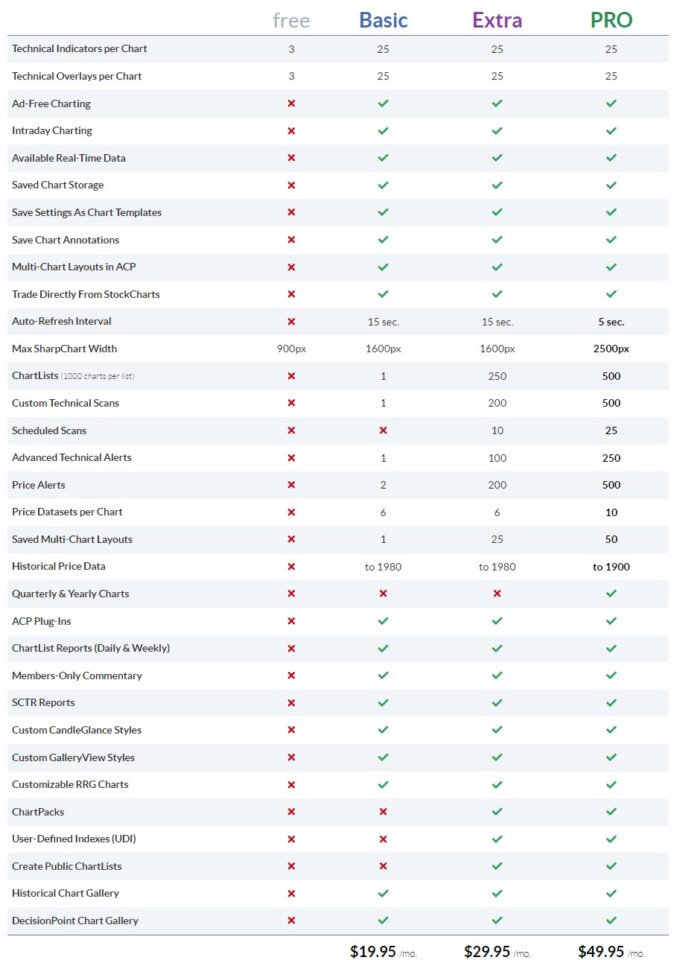
Stockcharts Plans
Stockcharts also offers four different subscription plans:
- Free
- Basic – $19.95 per month
- Extra – $29.95 per month
- PRO – $49.95 per month
Real-Time Data Plans
TradingView and Stockcharts offer free BATS or CBOE real-time data for the US region but are delayed for all other exchanges.
TradingView also offers real-time data packages for global exchanges with upgraded plans for additional fees.
Stockcharts offers Official data plans for $9.95 per month for the US, UK, Canada, and India.
TradingView vs. Stockcharts | Pros and Cons
TradingView Pros
- Offers a dedicated mobile application platform
- Easy setup and low pricing
- Usually a 30-day free trial for new users
- An ever-growing library of indicators
- Amazing charting experience
TradingView Cons
- More expensive highest-tier subscription compared to Stockcharts
Stockcharts Pros
- Easy setup
- 30-day free trial
Stockcharts Cons
- Doesn’t have a mobile app
- Annotations require a paid subscription
Supported Markets and Instruments
TradingView and Stockcharts offer access to most markets and instruments. In addition, both platforms provide delayed data and access to official real-time data at an extra cost with their paid plans.
TradingView and StockCharts offer access to Forex, Stocks, Futures, and cryptocurrencies.
However, Stockcharts provides only free delayed end-of-day futures data.
Both platforms also offer free BATS data access. BATS (Better Alternative Trading System) is an exchange based in Kansas City that provides free unofficial real-time trading data.
This data is often very similar to official data, but traders should be aware that there can be differences (including significant volume differences). In addition, BATS data is only available for US stocks.
TradingView allows users to pay for US real-time data individually($2 per month each) instead of Stockcharts, which only offers this service as a bundle($9.95 per month).
Selection of Indicators
Both Stockcharts and TradingView offer the most well-known technical indicators.
Stockcharts provides 70+ built-in technical indicators, which is quiet enough for a casual user. However, TradingView offers astonishing 100+ built-in technical indicators with 5,000+ third-party custom indicators, which create an unforgettable user experience.
TradingView has a vast and ever-growing library of third-party indicators, strategies, and user-made scripts. Its native programming language Pine Script is well-known to be an easy-to-learn and lightweight scripting language.
Pine Script creates an opportunity for traders with no previous programming experience to create their own indicators and contribute to the TradingView library.
Is TradingView Good for Day Trading?
TradingView is an excellent platform for day trading, offering a wide array of features that cater to the needs of short-term traders. Its user-friendly interface, extensive collection of technical indicators, and customizable charting options make it easy for day traders to monitor the markets and make quick decisions.
TradingView’s social networking components also allow day traders to learn from and collaborate with others in real time. The Pine Script language further enhances the platform’s capabilities, enabling traders to create custom studies and strategies tailored to their specific trading style.
TradingView vs. Stockcharts | Bottom Line
TradingView and StockCharts are powerful charting platforms catering to different types of traders and investors. While TradingView excels in its user-friendly design, social features, and custom scripting capabilities, StockCharts offers a clean and focused charting experience with expert market analysis.
When choosing between these platforms, consider your trading needs, preferred features, and budget to determine the best fit for you. Ultimately, both platforms provide robust tools and resources to help you succeed in the markets.
You can now take advantage of our link that usually gives you a 30-day free trial of TradingView.
TradingView has something for everyone. Use my link and unlock the full potential of TradingView today! I’d consider my TradingView review article as part of your research.
Before you go
If you want to keep educating yourself about personal finance, you must check out these posts as well:
What is the Most Successful Options Strategy
Options Trading for Income: The Complete Guide
Mark Minervini’s Trading Strategy: 8 Key Takeaways
The Best Options Trading Books
The Best Laptops and Computers for Trading
How to Get a TradingView Free Trial
The Best TradingView Indicators
Get Your Free Trading Resources
Grab the free trading journal template plus the same tools we use to stay organized, consistent, and objective.
- Free trading journal template
- Custom indicators, watchlists, and scanners
- Access our free trading community
Enter your email below to get instant access.
No spam. Unsubscribe anytime.


