TradingView Footprint Charts: How to Read and Trade Them (2026)
Footprint charts are not commonly offered on popular trading platforms, but TradingView offers them as a native chart type. They show buy and sell volume at every price level inside each bar, which pairs with TradingView’s Market Profile tool for order-flow reads. This guide covers how to access, read, and trade TradingView volume footprint charts in 2026.
Footprint data works best when paired with a directional read from chart patterns: the pattern tells you which direction institutional order flow is likely to push price next.
Key Takeaways of TradingView Footprint Charts
- Volume footprint charts on TradingView split each bar’s volume into bid-side and ask-side prints at every price level, then sum them into a delta value below the bar.
- Premium or higher is required for native access; the built-in public custom indicators offer a limited free alternative for lower tiers.
- The signals traders chase are imbalance (one side dominating at a price) and absorption (large volume at a level with no price movement), both of which the per-bar delta and POC markers surface directly.
Recommended Tool
Financial Tech Wiz Trading Journal
Log every footprint-driven entry with the delta read and POC level, then let the journal break down win rate by time of day, hold duration, and symbol so you can see whether order-flow setups are actually beating your baseline. Starting at $9.91/month billed annually.
Try It FreeExclusive Deal: 30-Day FREE Premium Access + Bonus Credit
Try TradingView’s Footprint Charts with No Cost – Start Your Free Trial Now!
- Access Footprint Charts
- Advanced Market Profile Tools
- Real-Time Data & Volume Analysis
What a Footprint Chart Actually Shows
A footprint chart replaces each candlestick’s body with a vertical ladder of price levels, showing how much volume traded at each level and whether the trade hit the bid or the ask. It takes what looks like a single candle and opens it up into a breakdown of order flow, one price tick at a time.
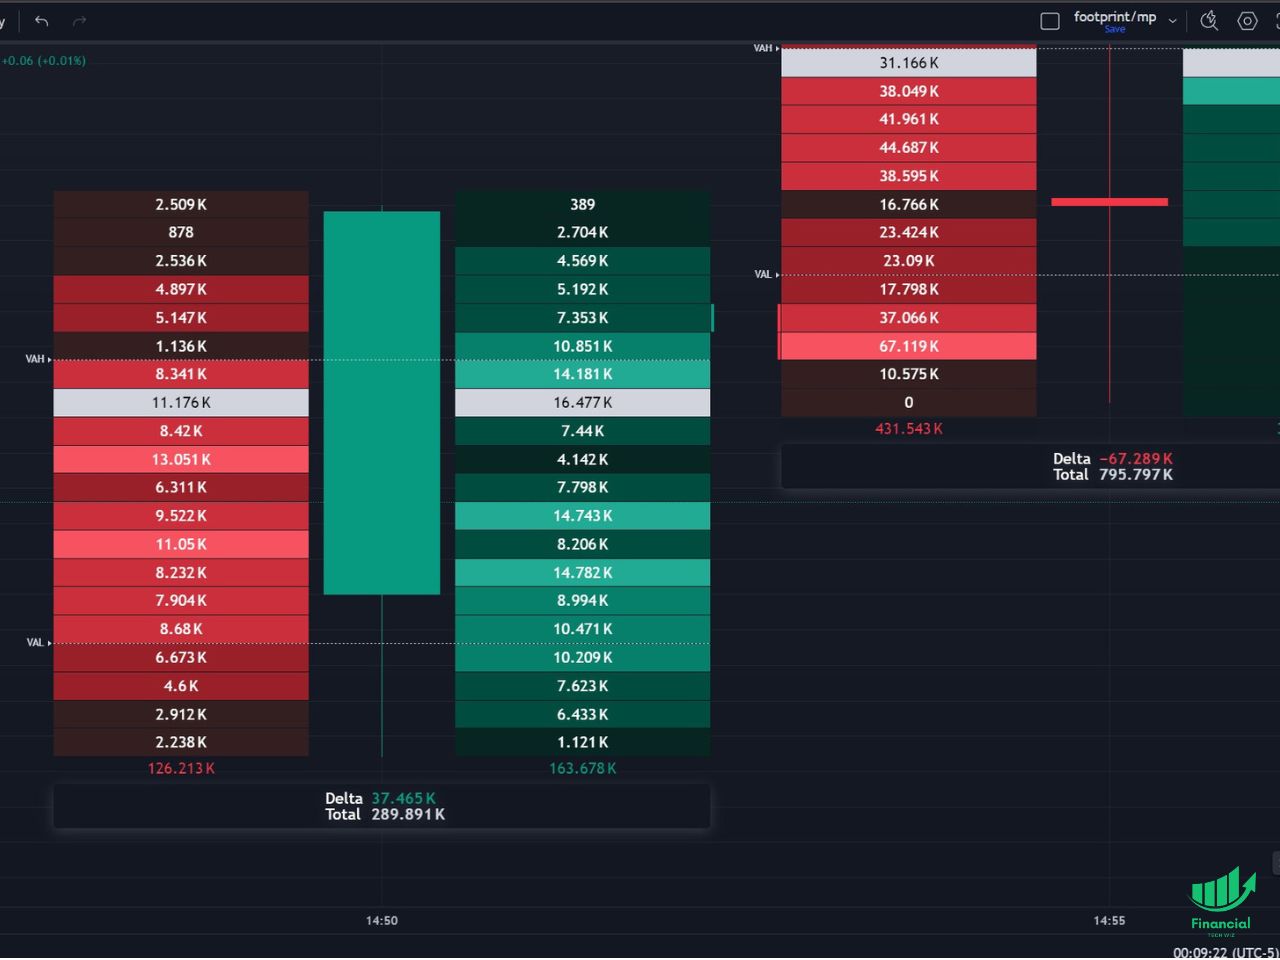
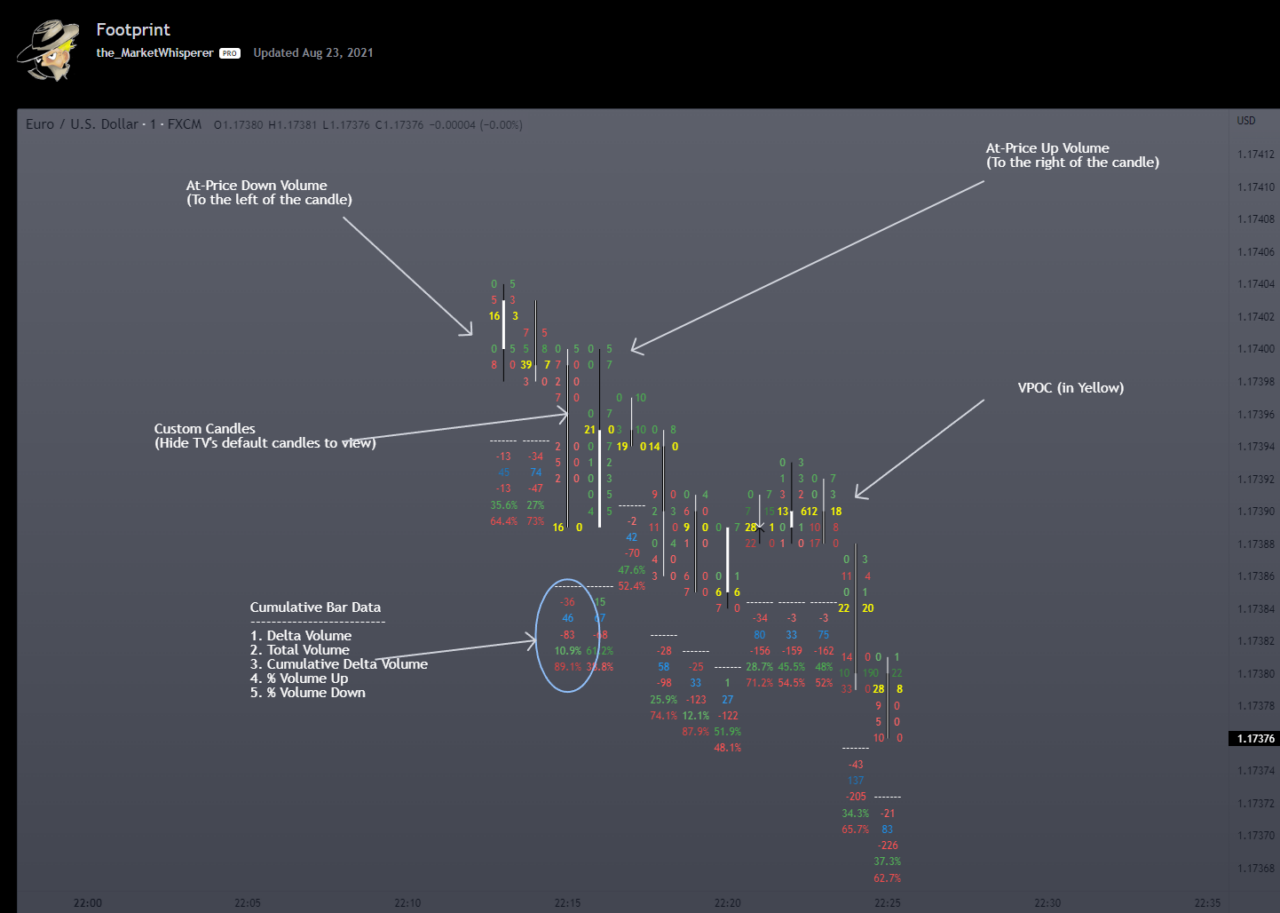
The anatomy of a single footprint bar has four parts. First, price levels are stacked vertically inside the bar, from the bar low at the bottom to the bar high at the top. Second, buy and sell volume is split into two columns at each level: ask-side volume on the right (aggressive buyers lifting the offer) and bid-side volume on the left (aggressive sellers hitting the bid). Third, colors are shaded by intensity so that heavier prints stand out visually against the lighter ones. Fourth, TradingView prints a delta value and a total volume value below the bar as summary stats.
Two markers inside the bar matter most for reading intent. The POC, or Point of Control, is the single price level where the most volume traded inside that one bar. TradingView highlights it automatically so you can spot at a glance where the bar’s balance sat. The Value Area is the tightest band of price levels that contains roughly 70% of the bar’s total volume, which tells you where the bulk of the two-sided business happened versus where price was just passing through.
Delta is the summary stat printed below the bar: ask-side volume minus bid-side volume. Positive delta means aggressive buyers dominated the bar. Negative delta means aggressive sellers dominated. The size of delta relative to total bar volume tells you how one-sided the tape actually was.
How to Access Footprint Charts on TradingView
Native volume footprint charts on TradingView require a Premium plan or higher on the 2026 pricing tier. Free, Essential, and Plus subscribers cannot load the native chart type, though the custom indicator workaround covered below does work on lower tiers with reduced fidelity.
To access TradingView footprint charts, follow these steps:
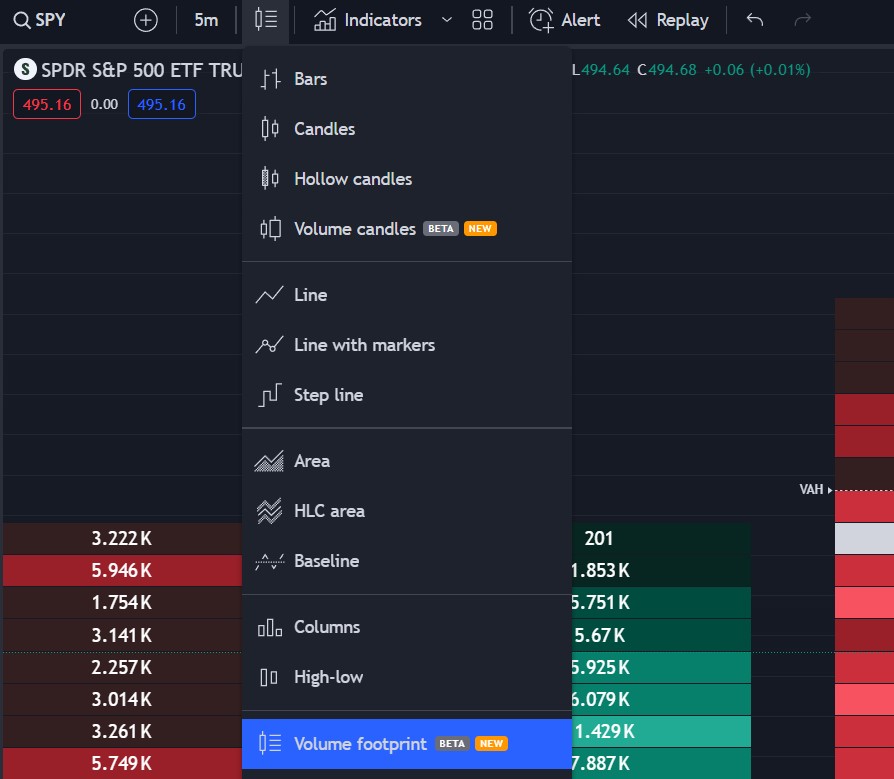
1. Click the chart-type button at the top left of the chart panel, just to the left of the indicators button. It shows the current chart type icon (candles by default).
2. Scroll the dropdown to the Volume section and click “Volume Footprint.”
3. The chart redraws with the footprint ladder defaults: bid/ask columns split per price level, POC highlighted inside each bar, and the delta plus total volume row below each bar.
You can use volume footprint on any timeframe, but most intraday traders stick to the 1, 5, and 30 minute charts where the per-bar ladder has enough prints to actually carry signal. If you do not have Premium yet, jump to the Custom Footprint Indicators section below for a free alternative, or use the affiliate link further down for a 30-day Premium trial to test it at no cost.
Understanding Footprint Charts
Footprint charts let you see how many orders filled on the bid versus the ask at each price level inside a bar. Day traders use them heavily on the 1, 5, and 30 minute charts because that is where the per-level prints have enough density to carry signal.
On the left side of the candle you see sell orders in red (bid hits), and on the right side the buy orders in green (ask lifts).
Below each bar you see delta and total volume. A positive delta means more aggressive buyers than sellers filled inside the bar; a negative delta means the opposite. In the language of auction market theory, that is the imbalance signal that drives price discovery one bar at a time.
How to Read a Footprint Bar, Step by Step
The four reads traders look for on a footprint bar are absorption, imbalance, exhaustion, and stacked imbalance clusters. Each one shows up differently on the ladder, and each one answers a different question about what just happened.
Absorption is when large volume trades at a single price level but price does not move through it. On the footprint, this looks like a row with an outsized print that is larger than the rows above and below, sitting at what should have been a breakout level. It tells you there were large resting orders on the other side absorbing the aggression without giving up ground, which often precedes a reversal in the direction of the resting side. This is the same order-flow concept traders watch for on the TradingView order book and DOM, just recorded after the fact.
Imbalance is when one side consistently dominates the other at a price level or across a short run of levels. TradingView flags a stacked imbalance when three or more consecutive price levels each show at least a 300% ratio between the ask side and the bid side (or the reverse). Stacked imbalances are one of the platform’s own internal signals and show up as highlighted arrows next to the ladder. Repeated clusters in one direction inside a bar are strong evidence of institutional aggression rather than retail noise.
Exhaustion is a delta divergence at the top of a move. Price keeps grinding up, but the delta below each successive bar shrinks or flips negative. It tells you aggressive buyers are losing conviction even though price has not rolled over yet. The same read applies in reverse on selling climaxes.
Stacked imbalance clusters combine the first two reads. When you see four or five consecutive price levels all showing 300%+ ask-side dominance inside a single bar, that cluster marks a price zone where forced buyers tried to punch through and either succeeded (if the next bar follows through) or got absorbed (if the next bar stalls and reverses). Walking forward bar by bar and noting where these clusters land gives you a map of where the aggressive side had to commit capital.
TradingView also added a Table Summary mode in late 2024. Instead of reading the raw ladder, the table shows bid-side volume, ask-side volume, delta, and total volume for each bar as columns in a separate panel. For newer order-flow traders the table is often faster to parse than the bar itself, and you can still toggle the ladder back on for the specific bars that matter.
Customizing the TradingView Footprint Settings
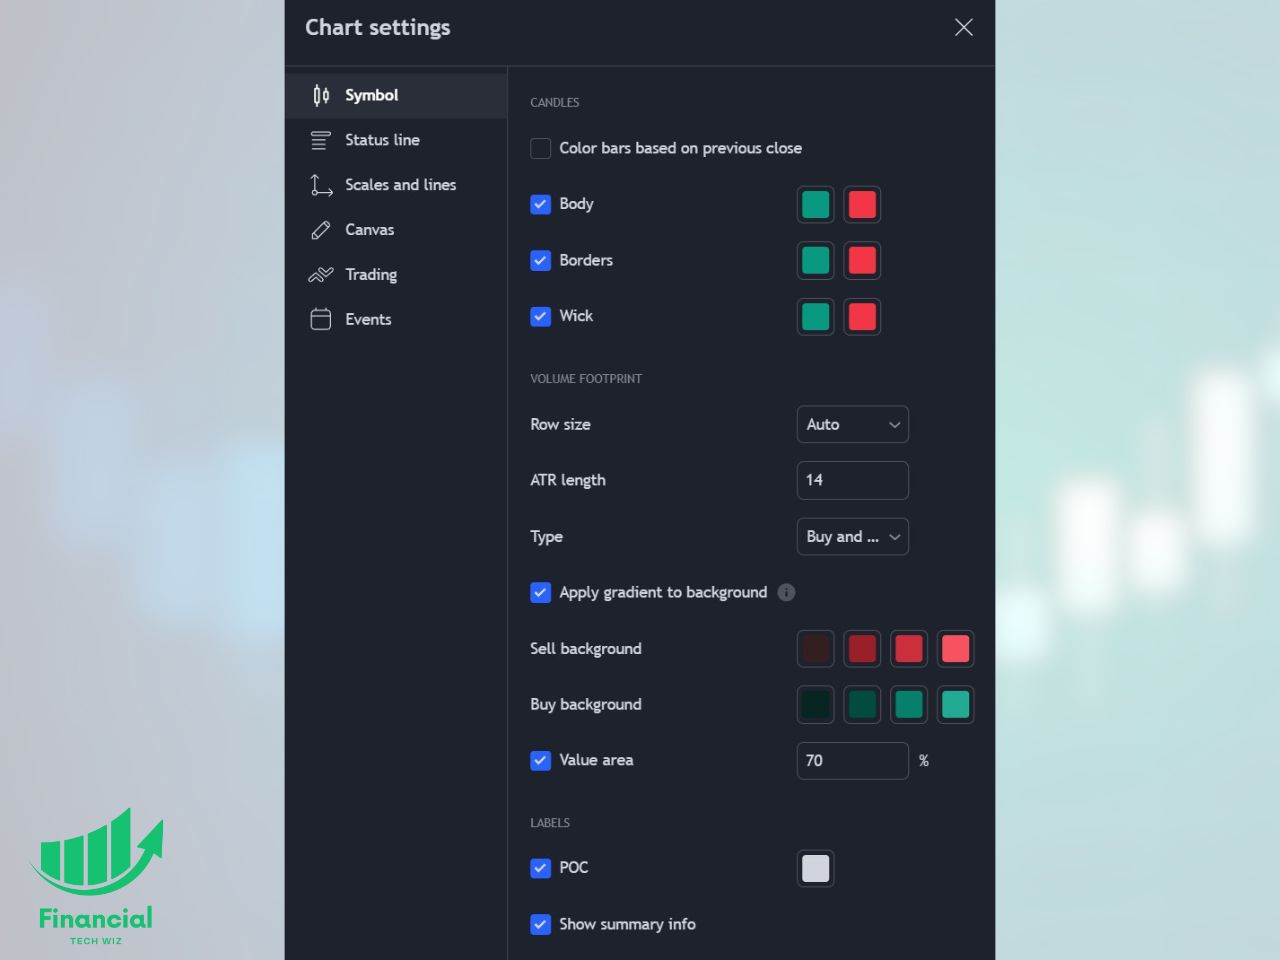
You can customize several footprint settings in the chart panel:
- Change the per-level display to buy/sell, delta, or total volume
- Change the color of the POC (Point of Control) highlight
- Customize the color of the bars and of the buy/sell volume columns
Footprint Charts vs Volume Profile vs Candlesticks
Candlesticks, volume profile, and footprint charts answer different questions about the same tape, which is why serious intraday traders run all three on the same screen.
Candlesticks show price only: open, high, low, close per bar. They are the best tool for reading structure across many bars at once (trend, swing highs and lows, consolidation). They tell you nothing about who was aggressive at which price.
Volume profile aggregates traded volume across a time range (a session, a day, a swing range) and plots it as a horizontal histogram down the side of the chart. It is the structural tool for longer-horizon support and resistance, since the heaviest-volume nodes tend to act as magnets on future tests. Traders use it alongside auction market theory to identify where the last accepted value area sits and where price is unaccepted.
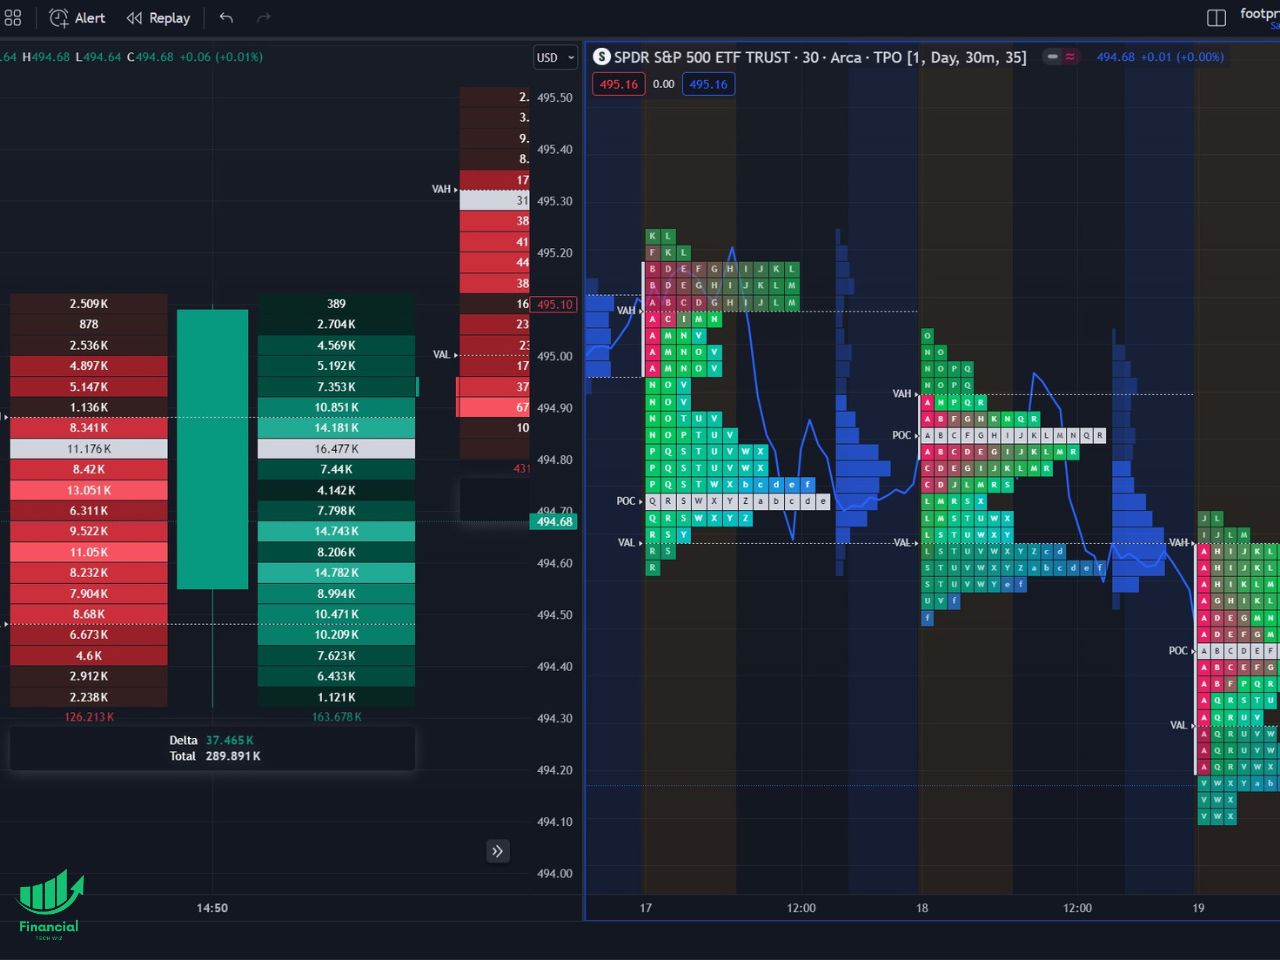
Footprint charts zoom that same volume-by-price idea all the way down to each individual bar. Within every single bar you see the ladder, the bid/ask split, the POC, and the delta. That makes footprint the right tool for granular order-flow reads at the entry and exit themselves, not for mapping the broader session. A common workflow is to use market profile trading or volume profile to pick the level, then drop to a 1 or 5 minute footprint to read what the tape is doing when price arrives there.
Get Your Free Trading Resources
Grab the free trading journal template plus the same tools we use to stay organized, consistent, and objective.
- Free trading journal template
- Custom indicators, watchlists, and scanners
- Access our free trading community
Enter your email below to get instant access.
No spam. Unsubscribe anytime.
When Footprint Charts Do Not Help
Footprint charts are not universal. Three specific situations produce more noise than signal, and knowing when to put them away is as useful as knowing when to pull them up.
Low-liquidity instruments on sub-1-minute bars. The entire premise of a footprint is that enough orders are printing at each price level that the bid/ask split means something. On a thin micro-cap or a quiet futures contract on a 15-second bar, you end up with a ladder where most rows show 1 or 2 contracts per side, which reveals nothing about aggression. Stick to liquid instruments (ES, NQ, CL, major large-caps, BTC/ETH on major exchanges) and push to the 1 or 5 minute timeframe before you draw conclusions from the delta.
The open and the close on equities. Between 9:30 and roughly 9:45 ET the order book is still reshuffling from overnight, and between 3:45 and 4:00 ET the book is draining into the MOC auction. Footprint reads in those windows mix genuine aggression with mechanical positioning and produce false absorption and false imbalance signals. Hold off on footprint-based entries until the book settles.
Crypto across mismatched feeds. TradingView pulls footprint data from specific exchange feeds (Binance, Coinbase, and so on). If your execution broker routes to a different feed, the bid/ask prints you are reading may not match the side your own order actually fills against. Confirm that the footprint symbol you are reading and the symbol you are trading share the same feed before you size up an order-flow-driven crypto entry.
If you are testing whether footprint reads are actually improving your edge, log the trades with the reason in the free trading journal template and compare the footprint-driven setups against your baseline for 30 sessions before drawing a conclusion.
Strategies for Trading with Footprint Charts
Volume footprint charts fit several common intraday strategies:
- Identifying key levels: footprint bars reveal areas of high liquidity and sustained two-sided trading, which pinpoint candidate support and resistance levels for the next session.
- Combine with the Market Profile: use the multi-chart feature on TradingView to run market profile and footprint side by side so that structural levels from profile line up with granular order flow from footprint.
- Detecting order flow imbalances: significant discrepancies between buying and selling pressure can signal trend reversals or points of capitulation, which is the textbook entry signal for order-flow traders.
Footprint Charts in Pine Script
TradingView added native volume-footprint support inside Pine Script in 2025. Before that, building anything that resembled a footprint required stitching together lower-timeframe security calls and approximating bid/ask splits from tick data, which most community scripts could not do cleanly. The 2025 update exposed the underlying footprint data directly to Pine, meaning script writers can now pull per-level bid and ask volume, POC, and delta into their own custom indicators and alerts.
Practically, this means three things. First, Pine-based alert scripts can now fire on stacked imbalance clusters, absorption at a specified level, or delta divergences without relying on visual inspection. Second, backtests that reference order-flow signals are finally feasible inside TradingView’s own environment instead of requiring a third-party platform. Third, the public-library custom footprint indicators that predate the 2025 update are largely obsolete: the native chart type plus new Pine access to footprint primitives replaces most of what those workarounds existed to solve.
How to Get TradingView Footprint Charts for Free
While the native TradingView footprint chart type requires a Premium subscription, free-tier users can leverage community-built custom indicators that approximate similar functionality. Two notable options are “Footprint Classic” by Investor_R and “Footprint” by MarketWhisperer. They are a reasonable free alternative, but the native chart type is materially more accurate because it reads true bid/ask prints instead of approximating from timeframe-aggregated volume. Here is what each covers:
- Footprint Classic by Investor_R: analyzes volume data within candles, splitting it into up volume and down volume. Similar display to the native footprint, but it cannot analyze historical data, so refreshing the chart wipes the accumulated data.
- Footprint by MarketWhisperer: provides real-time analysis of order-flow data, but also requires the chart to remain open and cannot reconstruct historical volume data.
How to Access and Use Custom Footprint Indicators on TradingView
Using the custom footprint indicators on TradingView is straightforward:
- Open the Indicators tab on the TradingView platform.
- Search for the desired custom indicator, such as “Footprint Classic” or “Footprint” by MarketWhisperer.
- Add the indicator to your chart and customize its settings according to your preferences.
TradingView Subscription Discount
Since the native TradingView footprint chart requires a Premium subscription, the cleanest way to test whether it is worth paying for is a 30-day free trial. Premium also includes market profile, volume profile, and up to 8 charts per layout, which is enough to run footprint plus profile plus a structural candlestick panel on the same screen.
FAQs
Does TradingView have footprint charts?
Yes. TradingView offers a native Volume Footprint chart type on Premium and higher plans. You access it from the chart-type dropdown in the top toolbar. There are also community custom indicators like “Footprint Classic” by Investor_R and “Footprint” by MarketWhisperer that approximate similar functionality on lower tiers. The video below walks through the native chart visually:

How do you read a volume footprint chart on TradingView?
Each bar is a ladder of price levels. Read the left column for bid-side volume and the right column for ask-side volume at that price, the POC marker for the highest-volume level inside the bar, and the delta number below the bar for the net buyer or seller aggression across the whole bar.
What is the POC on a footprint chart?
The Point of Control (POC) is the single price level inside a footprint bar where the most total volume traded. TradingView highlights it automatically so you can see at a glance where the bar’s balance sat.
What does volume delta mean on a footprint bar?
Delta is ask-side volume minus bid-side volume. Positive delta means more aggressive buying, negative delta means more aggressive selling. TradingView shows it as a number below each footprint bar so you can scan for divergences between delta and price direction.
Do footprint charts work for free TradingView users?
The native Volume Footprint chart type requires Premium or higher. Free-tier users can approximate footprint-style reads by loading community-built custom footprint indicators from the TradingView public library, with the caveat that those indicators rely on timeframe-aggregated volume rather than true bid/ask prints.
Are TradingView footprint charts worth it?
For active intraday traders on liquid instruments (index futures, large-cap equities, major crypto pairs) they pay for themselves quickly because imbalance and absorption reads are visible inside each bar. For swing traders on daily or higher timeframes the extra resolution is usually redundant to volume profile.
What is the difference between a footprint chart and a volume profile?
A volume profile aggregates traded volume across a time range (a session, a day, a range) and plots it as a horizontal histogram at the side of the chart. A footprint chart shows that same volume-by-price breakdown inside every individual bar, with bid versus ask split on each price level. Volume profile is for structural levels; footprint is for order-flow reads at the entry.
Before you go
If you want to keep sharpening your edge, these related guides pair well with footprint charts:
What is the Most Successful Options Strategy
Options Trading for Income: The Complete Guide
Mark Minervini’s Trading Strategy: 8 Key Takeaways
For options-focused traders, Option Omega adds backtesting that complements footprint chart analysis.
The Best Options Trading Books
The Best Laptops and Computers for Trading
How to Get a TradingView Free Trial
The Best TradingView Indicators
The Best Keyboards For Trading
This article contains affiliate links I may be compensated for if you click them.
Get Your Free Trading Resources
Grab the free trading journal template plus the same tools we use to stay organized, consistent, and objective.
- Free trading journal template
- Custom indicators, watchlists, and scanners
- Access our free trading community
Enter your email below to get instant access.
No spam. Unsubscribe anytime.


