
How to Use the Keltner Channel on TradingView

The Keltner Channel is one of the cleanest ways to read volatility and trend direction on a TradingView chart, yet most traders add it, glance at the bands, and never learn what the settings actually do. This guide walks through setting it up on TradingView, the settings that work best for your timeframe, and three ways to trade it: breakouts, trend pullbacks, and mean reversion. By the end you will know exactly when the indicator is telling you something and when it is just noise.
Key Takeaways
- The Keltner Channel plots an EMA with two bands set a multiple of Average True Range (ATR) away, so it tracks volatility more smoothly than Bollinger Bands.
- The default TradingView settings (20-period EMA, 10-period ATR, 2x multiplier) suit most swing traders; shorten the periods for scalping and lengthen the multiplier for trend-following.
- The indicator works best as a context tool: pair it with RSI, a moving average, or volume to confirm breakouts and avoid false signals, and log every Keltner setup so you can see which one actually pays.
Track your Keltner setups
Financial Tech Wiz Trading Journal
See which Keltner Channel setups (breakouts, pullbacks, mean reversion) actually make you money with automatic import, an equity curve, and AI insights across your trades by symbol and hold duration.
Start journaling your tradesWhat is the Keltner Channel, and Why Should You Use It?
The Keltner Channel was created by Chester Keltner, a commodity trader and financial analyst, in his 1960 book How to Make Money in Commodities. Since then, it has been modified and improved by various traders and analysts, most notably Linda Bradford Raschke.
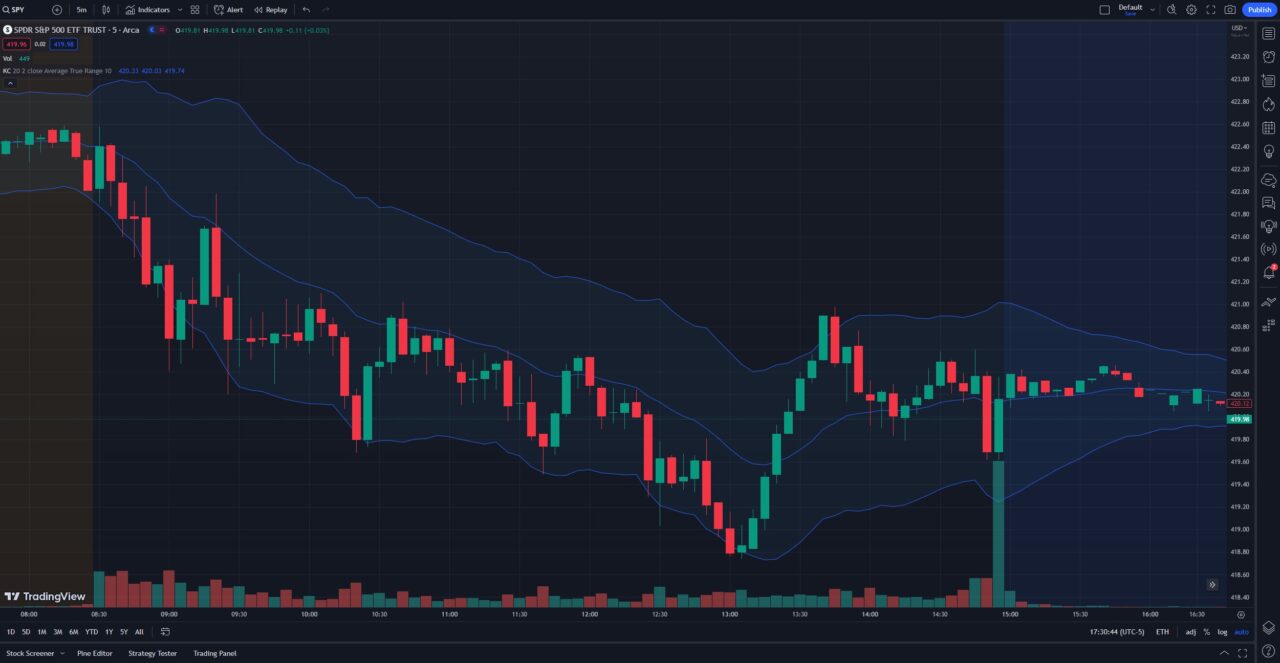
The Keltner Channel consists of three lines:
- The Upper Envelope, which is a moving average plus a multiple of the average true range (ATR)
- The Middle Line, which is a moving average of price (usually an exponential moving average)
- The Lower Envelope, which is a moving average minus a multiple of the ATR
The ATR is a measure of price volatility that takes into account the high, low, and close of each candlestick. The multiple of the ATR determines the width of the envelopes. The higher the multiple, the wider the envelopes.
Here is how the Keltner Channel looks on TradingView:
The Keltner Channel has several advantages over other banded indicators, such as Bollinger Bands or Moving Average Envelopes. Some of these advantages are:
- The Keltner Channel is less prone to false signals or whipsaws, as it uses the ATR instead of the standard deviation to measure volatility. The ATR is more stable and consistent than the standard deviation, which can fluctuate wildly depending on the price action.
- The Keltner Channel can adapt to different market conditions, as it expands and contracts with the ATR. This means that the envelopes can adjust to the changing volatility and price range of the market, giving you more accurate signals.
- The Keltner Channel can help you identify price trends, as it shows you the direction and strength of the moving average. When the price is above the middle line, it indicates an uptrend. When the price is below the middle line, it indicates a downtrend. The steeper the slope of the middle line, the stronger the trend.
How to Set Up the Keltner Channel on TradingView
Setting up the Keltner Channel on TradingView is easy and straightforward. Here are the steps you need to follow:
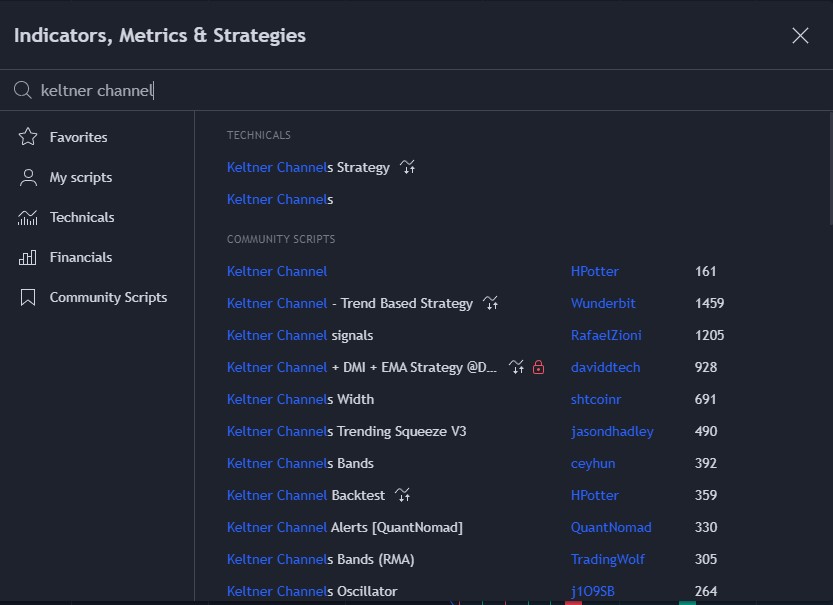
- Open any chart on TradingView and click on the Indicators button at the top of the screen.
- Type “Keltner Channel” in the search box and select the indicator from the list.
- The Keltner Channel will appear on your chart with the default settings. You can customize these settings by clicking on the Settings icon next to the indicator name.
- In the settings window, you can change various parameters of the Keltner Channel, such as:
- Indicator Timeframe: Specifies the timeframe that the indicator is calculated on. This option allows calculating KC based on data from another timeframe, e.g., having KC calculated on 1H chart be displayed on a 5m chart.
- Length: The time period to be used in calculating the MA which creates the base for the Upper and Lower Envelopes (20 is the default).
- Multiplier: The multiplier to be applied to the bands.
- Source: Determines what data from each bar will be used in calculations. Close is the default.
- Use Exponential MA: Determines if a simple or exponential moving average will be used for the basis.
- Bands Style: Determines if high/low range or average true range will be used for the bands.
- ATR Length: The time period to be used in calculating the Average True Range.
- Style: Allows you to change the color, thickness, and style of the Upper, Middle, and Lower lines. You can also toggle the visibility of a background color within the bands.
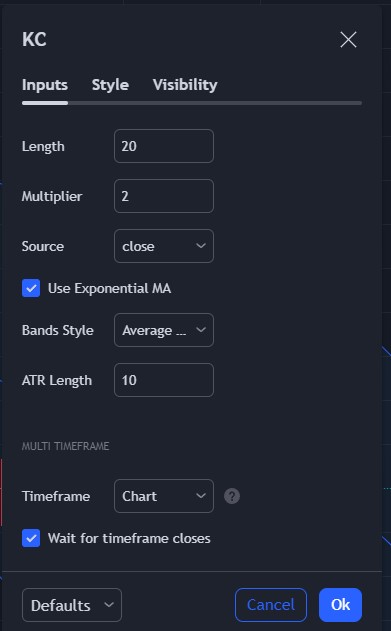
Once you are happy with your settings, click on OK to apply them to your chart.
TRADINGVIEW
Chart the Keltner Channel on TradingView Free
The Keltner Channel indicator, plus thousands of other free community scripts, is available the moment you open a TradingView chart.
How the Keltner Channel Is Calculated (EMA and ATR)
The Keltner Channel is built from two familiar pieces. The middle line is an exponential moving average (EMA) of price, usually over 20 periods. The upper and lower bands sit a fixed multiple of the Average True Range (ATR) above and below that EMA. In plain terms: the middle line tells you the trend, and the ATR-based bands widen when the market gets volatile and contract when it calms down.
The formula is straightforward:
- Middle line = 20-period EMA of closing price
- Upper band = EMA + (multiplier x ATR)
- Lower band = EMA – (multiplier x ATR)
The default multiplier is 2 and the default ATR length is 10. Because the bands are tied to ATR rather than standard deviation, the Keltner Channel reacts to real price range instead of statistical dispersion, which is the core reason it behaves differently from Bollinger Bands. On TradingView, you do not have to calculate any of this by hand: the built-in Keltner Channels indicator handles it once you set the inputs, which we cover next.
Best Keltner Channel Settings on TradingView
There is no single “correct” setting, but there is a sensible default and clear adjustments by style. TradingView ships the Keltner Channels indicator with a 20-period EMA, a 10-period ATR, and a 2.0 multiplier. That combination is a solid starting point for swing and position trading on daily charts.
Adjust from there based on how you trade:
- Scalping and fast intraday: shorten the EMA to 9-14 and the ATR to 7-10 so the bands react faster to short bursts of volatility. Expect more signals and more noise.
- Day trading: the 20 / 10 / 2 default on 5-minute to 15-minute charts is a good balance of responsiveness and reliability.
- Swing and position trading: keep the 20-period EMA but consider widening the multiplier to 2.5 or 3 so only meaningful moves push price outside the channel. This filters out minor wiggles and keeps you in trends longer.
A practical rule: the wider your multiplier, the fewer but higher-quality the band touches. The shorter your periods, the more reactive but choppier the signals. Whatever you choose, keep it consistent long enough to judge it, and log the settings you used on each trade so you can compare results instead of guessing.
New to journaling?
Free Trading Journal Template
Not ready for an app yet? Grab the free Google Sheets journal and start recording your Keltner Channel settings, entries, and exits so you can spot which settings hold up over time.
Get the free templateGet Your Free Trading Resources
Grab the free trading journal template plus the same tools we use to stay organized, consistent, and objective.
- Free trading journal template
- Custom indicators, watchlists, and scanners
- Access our free trading community
Enter your email below to get instant access.
No spam. Unsubscribe anytime.
Best Timeframe for the Keltner Channel
The Keltner Channel works on every timeframe, so “best” depends on your trading style rather than the indicator itself.
- Scalpers tend to use 1-minute to 3-minute charts with shorter EMA and ATR settings.
- Day traders usually settle on 5-minute to 15-minute charts with the standard settings.
- Swing traders favor the 1-hour, 4-hour, and daily charts, where band touches are less frequent but more reliable.
- Position traders and investors can use the daily and weekly charts to frame the larger trend.
A useful habit is multi-timeframe alignment: confirm the trend on a higher timeframe, then time entries on a lower one. For example, if price is riding the upper half of the channel on the daily chart, you can look for pullback entries to the middle line on the 1-hour chart in the same direction.
How to Trade with the Keltner Channel on TradingView
Now that you have the Keltner Channel on your chart, how do you use it to trade? There are several ways to trade with the Keltner Channel, depending on your trading style and objectives. Here are some of the most common and effective strategies:
Breakout Trading
One of the simplest and most popular ways to trade with the Keltner Channel is to look for breakouts above or below the envelopes. A breakout occurs when the price closes outside of the envelopes, indicating a strong price movement in that direction.
A breakout above the upper envelope signals a bullish breakout, meaning that the price is likely to continue rising. A breakout below the lower envelope signals a bearish breakout, meaning that the price is likely to continue falling.
To trade breakouts with the Keltner Channel, you can use the following rules:
- Wait for a candlestick to close above or below the envelopes.
- Enter a long position if the breakout is above the upper envelope, or a short position if the breakout is below the lower envelope.
- Place a stop-loss order below or above the opposite envelope, or use a trailing stop to lock in profits as the price moves in your favor.
- Exit your position when the price reaches your target, or when it reverses and closes back inside the envelopes.
Trend Following
Another way to trade with the Keltner Channel is to use it as a trend following indicator. This means that you trade in the direction of the prevailing trend, as indicated by the position and slope of the middle line.
When the price is above the middle line and the middle line is sloping upward, it indicates an uptrend. When the price is below the middle line and the middle line is sloping downward, it indicates a downtrend.
To trade trend following with the Keltner Channel, you can use the following rules:
- Identify the direction and strength of the trend by looking at the position and slope of the middle line.
- Enter a long position if the price is above the middle line and the middle line is sloping upward, or a short position if the price is below the middle line and the middle line is sloping downward.
- Place a stop-loss order below or above the opposite envelope, or use a trailing stop to lock in profits as the price moves in your favor.
- Exit your position when the trend changes, or when it reaches your target.
Mean Reversion
A third way to trade with the Keltner Channel is to use it as a mean reversion indicator. This means that you trade against the prevailing trend, expecting that the price will revert to the mean, which is the middle line.
When the price is above the upper envelope, it indicates that the price is overbought and likely to fall. When the price is below the lower envelope, it indicates that the price is oversold and likely to rise.
To trade mean reversion with the Keltner Channel, you can use the following rules:
- Wait for the price to reach or cross the upper or lower envelope.
- Enter a short position if the price is above the upper envelope, or a long position if the price is below the lower envelope.
- Place a stop-loss order above or below the opposite envelope, or use a trailing stop to lock in profits as the price moves in your favor.
- Exit your position when the price reaches or crosses the middle line, or when it reaches your target.
How to Combine the Keltner Channel with Other Indicators or Chart Patterns
The Keltner Channel can be a powerful indicator on its own, but it can also be combined with other indicators or chart patterns to confirm or enhance your signals. For a broader reference on the setups it pairs with, see our guide to chart patterns. Here are some of the most common and effective combinations:
- Moving Averages: You can use moving averages to filter out noise and identify the long-term trend. For example, you can use a 50-period simple moving average (SMA) to determine the trend direction, and only trade in that direction with the Keltner Channel. Alternatively, you can use a faster moving average, such as a 10-period exponential moving average (EMA), to act as a dynamic support or resistance level, and trade with the Keltner Channel when the price bounces off or breaks through the EMA.
- Oscillators: You can use oscillators, such as the Relative Strength Index (RSI) or the Stochastic Oscillator, to measure the momentum and strength of the price movement. For example, you can use the RSI to confirm overbought and oversold conditions with the Keltner Channel, and look for divergences or convergences between the price and the RSI. Alternatively, you can use the Stochastic Oscillator to identify potential trend reversals with the Keltner Channel, and look for bullish or bearish crossovers between the %K and %D lines.
- Candlestick Patterns: You can use candlestick patterns, such as doji, hammer, engulfing, or shooting star, to indicate the sentiment and psychology of the market participants. For example, you can use a doji candlestick to signal indecision or uncertainty with the Keltner Channel, and look for a confirmation candlestick in the next period. Alternatively, you can use a hammer or shooting star candlestick to signal a possible reversal with the Keltner Channel, and look for a confirmation candlestick in the opposite direction.
Keltner Channel vs Bollinger Bands
These two indicators look almost identical on a chart, which is exactly why traders confuse them. The difference is in how the bands are measured. Bollinger Bands set their bands a number of standard deviations from a simple moving average, so they react to statistical volatility and can expand and contract sharply. The Keltner Channel sets its bands a multiple of ATR from an EMA, so it tracks the actual trading range and tends to produce smoother, steadier bands.
| Feature | Keltner Channel | Bollinger Bands |
|---|---|---|
| Middle line | EMA (default 20) | SMA (default 20) |
| Band calculation | Multiple of ATR | Standard deviations of price |
| Band behavior | Smoother, range-based | More reactive, dispersion-based |
| Best for | Trend and breakout context | Volatility squeezes and reversals |
Many traders run both together: when the narrower Bollinger Bands move inside the Keltner Channel, it signals a volatility squeeze that often precedes a strong directional move. The key is to know which of the best TradingView indicators to pair with it so each one confirms rather than repeats the other.
Advantages and Limitations of the Keltner Channel
Like every indicator, the Keltner Channel is a context tool, not a crystal ball.
What it does well:
- Smooths out volatility readings so the bands are easier to interpret than Bollinger Bands in choppy conditions.
- Defines trend direction at a glance: price holding the upper half points to strength, the lower half to weakness.
- Gives objective, repeatable rules for breakout and pullback entries.
Where it falls short:
- In a strong trend, price can ride a band for a long time, so treating every band touch as “overbought” or “oversold” will get you run over.
- It lags, because it is built on a moving average, so it confirms moves rather than predicting them.
- Used alone it produces false signals in sideways markets, which is why confirmation with RSI, a moving average, or volume matters.
The honest takeaway: the Keltner Channel is excellent at framing context and weak as a standalone signal. The traders who get value from it are the ones who combine it with one or two confirming tools and then keep records of which combinations actually work for them with the Financial Tech Wiz Trading Journal.
Conclusion
The Keltner Channel is a versatile and effective indicator that can help you identify price trends, volatility levels, and potential trading opportunities on TradingView. You can use it to trade breakouts, trend following, mean reversion, or any combination of these strategies. You can also combine it with other indicators or chart patterns to confirm or enhance your signals.
The Keltner Channel is easy to set up and customize on TradingView, and you can experiment with different settings and strategies to find what works best for you. If you want to learn more about the Keltner Channel or other TradingView indicators, check out our other articles on VWAP TradingView, Best TradingView Indicators, and TradingView Moving Average.
FAQ
What are the best Keltner Channel settings?
The most common default is a 20-period EMA, a 10-period ATR, and a 2.0 multiplier, which suits swing and position traders. Shorten the EMA and ATR for scalping and intraday trading, and widen the multiplier toward 2.5 or 3 if you want fewer, higher-quality band touches in longer-term trends.
What is the best timeframe for the Keltner Channel?
It depends on your style. Scalpers use 1-minute to 3-minute charts, day traders use 5-minute to 15-minute charts, and swing and position traders use the 1-hour, 4-hour, daily, and weekly charts. Confirming the trend on a higher timeframe and entering on a lower one is a reliable approach.
What indicators work well with the Keltner Channel?
RSI, MACD, moving averages, and volume all pair well with it. The Keltner Channel frames trend and volatility context, and a momentum or volume indicator confirms whether a band touch is a genuine signal or noise.
Keltner Channel vs Bollinger Bands: what is the difference?
Both plot a middle moving average with upper and lower bands, but Bollinger Bands measure the bands in standard deviations from an SMA while the Keltner Channel measures them as a multiple of ATR from an EMA. The Keltner Channel produces smoother, range-based bands, which makes it better for trend context, while Bollinger Bands react faster to volatility squeezes.
Get Your Free Trading Resources
Grab the free trading journal template plus the same tools we use to stay organized, consistent, and objective.
- Free trading journal template
- Custom indicators, watchlists, and scanners
- Access our free trading community
Enter your email below to get instant access.
No spam. Unsubscribe anytime.







