Best Charting Software for Traders
This article will explore my favorite charting software for stocks, and give you a basic overview of the various features offered. My favorite overall charting software for stocks is TradingView, as it offers free real-time data whenever possible, and allows you to track all assets from a single platform.
Best Charting Software At a Glance
- I believe TradingView is the best charting software thanks to its freemium pricing model and because it supports all assets.
- thinkorswim is the best free stock charting software if you already have a funded Schwab account.
- TrendSpider is a solid charting platform if you want to use 16 charts per layout and access to automated technical analysis tools.
Best Charting Software Compared
- Free real-time data when possible
- Custom indicators
- Integrates with various brokers
$15 referral credit
- 16 charts per layout
- Real-time data included in price
- No code custom indicators
25% off Coupon code: FTW25
- AI stock scanning features
- Best for day traders
- Real-time data included in price
15% off link
- Best overall: TradingView
- Most charts per layout: TrendSpider
- Best free stock charting: thinkorswim
- Best day trading tools: Trade Ideas
- Free automated trendlines: Finviz
- Best value: TC2000
TradingView
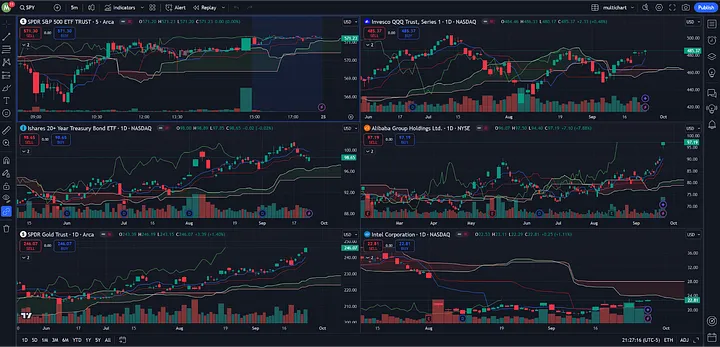
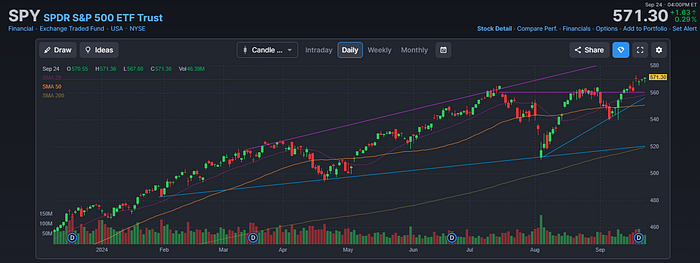
TradingView is the best charting software for stocks because it does everything for a great price. From advanced indicators like the volume profile to backtesting, TradingView has you covered. It also provides intraday charting for free, you just need to sign up for an account. It also is one of the few charting platforms that offers footprint and market profile chart types, which are incredibly useful for day trading, and generally only available on smaller niche platforms like Sierra Charts.
TradingView offers much more than just charting, including screeners for all assets, heatmaps, economic calendars, backtesting, and paper trading features. You can also integrate multiple brokers like Interactive Brokers and Webull to trade directly from the charts. Additionally, if you pay for real-time data via your broker, you can connect it to your TradingView account. The interface is modern and easy to use for both beginners and advanced traders.
TradingView Key Features
- An extensive library of technical indicators
- Customizable charts and drawing tools
- Real-time data and alerts
- Community-made custom indicators
- Seamlessly draw on charts
- Screeners for all assets
- Heatmaps
- Supports stocks, crypto, forex, futures
TradingView Pros
- Supports all assets: Track all assets, including stocks, futures, crypto, forex, and more
- Support advanced chart types: Use advanced features like Footprint, market profile, and volume profile
- Automated analysis tools: Offers automated trendlines and pattern recognition
- Tools beyond charting: Use additional features like heatmaps, screeners, custom indicators, and economic calendars
TradingView Cons
- Limited charts per layout: Non-professional plans limit charts per layout to 8
- Advanced features are expensive: Advanced features like footprint charts require the highest non-professional subscription plan
TradingView Supported Assets
TradingView supports stocks, ETFs, futures, crypto, and forex.
TradingView Pricing
TradingView is free to use, but the premium features range from $12-$60 per month depending on which plan you choose. TradingView also offers professional plans which range from $200-$600 per month. However, most retails traders will be just fine sticking with the non-professional plans.
Exclusive Deal: 30-Day FREE Premium Access + Bonus Credit
Don’t Miss Out – Sign up for TradingView Now!
- Advanced Charts
- Real-Time Data
- Track all Markets
TrendSpider
TrendSpider is an innovative charting platform that offers several unique features like its proprietary raindrop charts and an AI chatbot assistant. You can prompt the AI assistant to perform any action on the platform, making setting up screens and finding the information you need a breeze.
TrendSpider also allows you to use advanced indicators like volume by price and set up screens based on indicators. You can track all markets on TrendSpider, including stocks, crypto, forex, and more.
TrendSpider Key Features
- Automated Technical Analysis: TrendSpider’s AI-driven system can automatically identify and draw trend lines, Fibonacci levels, and candlestick patterns, making it easier for traders to spot potential trading opportunities.
- Dynamic Price Alerts: Users can set alerts based on technical indicators or price movements, ensuring they never miss a key trading moment.
- Multi-Timeframe Analysis: This feature allows traders to overlay multiple timeframes on a single chart, providing a more comprehensive view of the market.
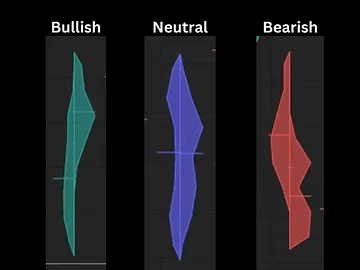
- Raindrop Charts: A unique feature to TrendSpider, Raindrop Charts are a novel way of visualizing volume and price action, offering insights that traditional candlestick charts may not provide.
- Backtesting Capabilities: Traders can test their strategies using historical data, which is crucial for refining trading approaches.
TrendSpider Pros
- AI chatbot: Easily perform any action using the AI assistant
- Excellent screeners: Screen for assets based on technical or fundamental criteria
- Included real-time data: Real-time data is included with the premium price
TrendSpider Cons
- Pricey subscription plans: A bit expensive when not on sale
- Performance issues: The platform can be a bit laggy at times
TrendSpider Supported Assets
- Stocks, ETFs, futures, crypto, and forex
TrendSpider Pricing
Depending on the current sale, TrendSpider costs around $74-$149 per month. You can also get 25% off using my affiliate link and the coupon code FTW25.
TrendSpider Special Offer!
Exclusive Deal: 25% Discount with Code FTW25
Elevate Your Trading – Join TrendSpider Today!
- AI-Powered Analysis
- Automated Technical Analysis
- 16 charts per layout
- Read my Full TrendSpider Review
- For a detailed comparison with other platforms like TradingView, check out my comprehensive review of TrendSpider vs. TradingView.
thinkorswim
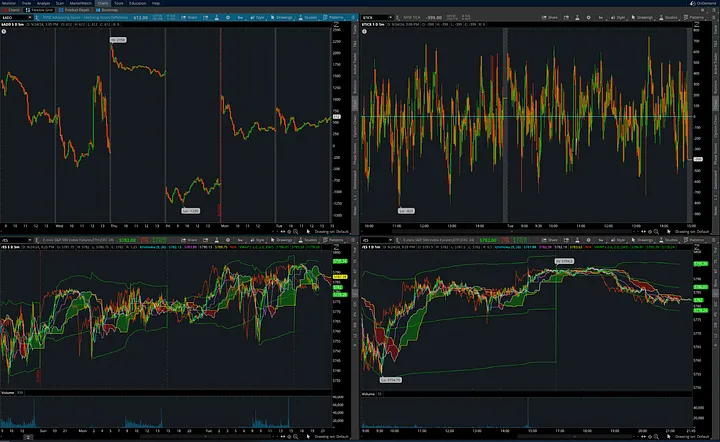
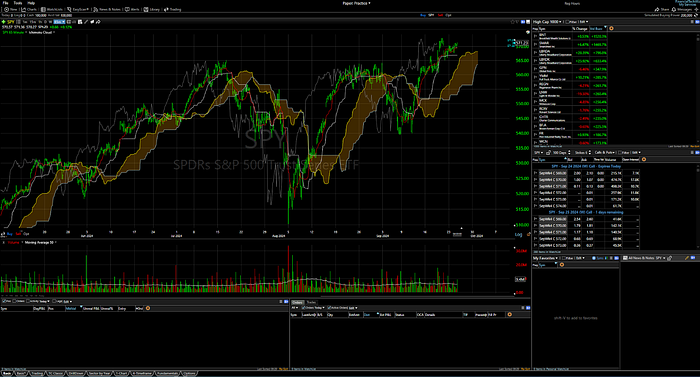
thinkorswim is the OG charting software for stocks, founded by Tom Sosnoff in the late 90s, then sold to TD Ameritrade in 2009. While the platform may look old, it provides tons of advanced features like volume profiles, money bar charts (similar to market profiles), the ability to code custom indicators with thinkscript, and much more. The platform also offers a solid screener for stocks and options.
thinkorswim is a free charting software available to Schwab account holders. You can access thinkorswim for free, including real-time data, as long as you have a funded Schwab account. This makes it the best free option and is a great platform if you don’t want to spend money on more modern charting software.
thinkorswim Pros
- Free real-time data: Free for Schwab account holders
- thinkscript coding language: Ability to use and code custom indicators
- Advanced indicators: Offers advanced indicators like the volume profile
- Charting and broker capabilities: Trade directly from the platform via your Schwab accounts
thinkorswim Cons
- Limited asset support: Doesn’t support crypto like most charting platforms
- Limited access: Only available to Schwab account holders
- Dated design and UX: The platform was made in the 90s, and it shows
thinkorswim Supported Assets
- Stocks, ETFs, Mutual Funds, Options, Index Options, Futures, Futures Options, Bonds
thinkorswim Pricing
thinkorswim is completely free to use but only for those with a funded Schwab account. The platform even provides free real-time data.
Trade Ideas
Trade Ideas offers a sophisticated stock scanning and charting platform with real-time quotes, indicators, and heatmaps. Although the dashboard may appear complex initially, it can be easily tailored to focus on specific tools, such as charting, screeners, or heatmaps. This platform continuously monitors the stock market and highlights trending stocks, making it particularly useful for day traders.
Trade Ideas is ideal for day and swing traders who require a premium platform to track the day’s most active stocks. Users can quickly filter stocks based on metrics such as daily volume percentage, gap percentage, percentage change from the open, and more.
Trade Ideas Pros
- Excellent screeners: Provides real-time scanning with customizable filters to spot trading opportunities quickly
- AI-powered insights: Uses AI (Holly) to generate trade ideas based on historical data and current market trends
- Customizable dashboard: Users can tailor the interface to focus on the tools and data they prefer, reducing the complexity of the platform
- Real-time market data: Offers real-time data included in the subscription price
Trade Ideas Cons
- Tough learning curve: The platform can be overwhelming for beginners due to its advanced features and layout
- Expensive subscription plans: Trade Ideas is more expensive compared to other stock screening platforms, which might not be ideal for traders on a budget
- Mediocre charting tools: While Trade Ideas excels in scanning and stock screening, its charting capabilities are not as user-friendly
Trade Ideas Supported Assets
- Stocks, ETFs, futures, crypto, and forex
Trade Ideas Pricing
Depending on the current sale, Trade Ideas costs $89-$179 per month, and you can get 15% off using my affiliate link.
Finviz
Finviz is a versatile platform that specializes in stock charting and fundamental analysis, though it also supports limited features for cryptocurrencies, futures, and forex. It allows users to quickly access charts, view analyst price targets, and retrieve key fundamental data for most stock tickers, making it a valuable tool for both traders and investors.
Finviz is particularly well-suited for swing traders looking for a free platform to easily access essential charting tools, fundamental data, and analyst forecasts. The platform’s features, such as auto-generated trendlines and indicators, simplify the process of identifying potential trading and investment opportunities.
For those who need more advanced functionality, Finviz Elite provides intraday data and real-time updates, making it a better option for day traders. However, it’s important to note that platforms like TradingView offer nearly real-time intraday data for free on most stock tickers.
Finviz Pros
- Free access to essential tools: The basic version offers great value for swing traders, providing a wide range of charting tools, stock screeners, and fundamental data without the need for a subscription.
- Stock screener capabilities: Finviz’s stock screener is highly customizable, allowing users to filter stocks based on various criteria like market cap, P/E ratio, and performance metrics.
- Heat maps and visualization tools: Offers heat maps and sector analysis, making it easy to identify market trends and visualize which sectors are leading or lagging.
- Auto-generated chart features: Finviz automatically plots trendlines and technical indicators like moving averages, simplifying technical analysis for beginners and experienced traders alike.
- Finviz Elite: The premium plan provides real-time data, advanced charting, backtesting features, and faster updates for serious traders.
Finviz Cons
- Delayed data for free users: The free version provides delayed data, making it less useful for day traders who need real-time updates.
- Limited customization in free version: While Finviz offers great features for free, the customization options for charts and data are more restricted compared to premium platforms.
- Basic interface: While functional, the platform’s design may feel outdated compared to more modern charting tools like TradingView or thinkorswim.
Finviz Supported Assets
- Stocks, ETFs, futures, crypto, and forex
Finviz Pricing
Finviz is free to use, but Finviz Elite costs $24-$40 per month. You may be able to get a discount when you sign up using my affiliate link as well.
TC2000
TC2000 is a comprehensive platform that offers stock and options trading, along with advanced charting and screening tools. It is best for traders looking to chart and place trades on one platform. It also includes unique features like options charting. However, while TC2000 offers great charting, it still charges high commissions for trading. Many other brokers provide commission-free stock trading and lower options trading fees, such as thinkorswim and tastytrade.
TC2000 is most beneficial for traders willing to pay a premium for advanced features like IB SmartRoutingSM, which ensures the best possible order fills by routing trades through the most favorable market centers. Although this is a valuable feature, other brokerages, such as tastytrade, also provide excellent order execution but at significantly lower commission rates. For those who are primarily in search of a charting platform, TradingView may be a better alternative, as it offers most of its features for free and provides highly customizable charting tools.
TC2000 Pros
- Advanced charting tools: Users can apply technical indicators, create custom scans, and use options charting, a feature that is not commonly found in other charting platforms.
- Real-time data and execution: The platform offers live market data, along with tools like SmartRouting, to ensure optimal order fills.
- Customization: TC2000 provides highly customizable watchlists, layouts, and technical indicators, allowing users to tailor their trading environment to their specific needs.
- Brokerage integration: Users can seamlessly trade directly through the platform, which integrates real-time brokerage services with advanced charting.
TC2000 Cons
- High trading commissions: TC2000’s trading commissions and options fees, are higher than many other brokers, making it less appealing for cost-conscious traders. Competitors like thinkorswim and tastytrade offer free equity trades and significantly lower options commissions.
- The free version has 15-minute delayed data: While other platforms, such as TradingView, offer a free version with most features, TC2000 requires a subscription to access real-time data and advanced tools.
TC2000 Supported Assets
- Stocks, ETFs, & Options
TC2000 Pricing
TC2000 is free to use with delayed data, but premium pricing costs $8-$50/month, depending on which plan you choose. You can also save $25 when you sign up using my affiliate link.
The Best Charting Software for Stocks Compared
The table below lists all of the best charting software for stocks, and compares the features of all of them:
| Provider | Key Features | Pros | Cons | Pricing |
|---|---|---|---|---|
| TradingView Free trial |
– Advanced indicators (volume profile, market profile) – Intraday charting – Customizable charts – Heatmaps & screeners – Broker integration |
– Supports all assets – Advanced chart types (Footprint, Market Profile) – Backtesting & automation – Beginner-friendly interface |
– Limited charts per layout on non-pro plans – Premium features can be pricey |
Free with basic features Premium plans: $12-$60/month Pro plans: $200-$600/month |
| TrendSpider 25% discount |
– Raindrop Charts – Multi-timeframe analysis – AI assistant for automation – Volume-by-price indicators – Backtesting tools |
– AI-powered tools for ease of use – Includes real-time data – Excellent screeners for assets |
– Higher subscription cost – Occasional lag in performance |
$74-$149/month 25% off with code FTW25 |
| thinkorswim Visit site |
– Advanced indicators (volume profile, thinkscript coding) – Stock & options screeners – Real-time data |
– Free with Schwab account – Highly customizable through coding – Advanced features at no cost |
– Requires funded Schwab account – Dated user interface |
Free for Schwab account holders |
| Trade Ideas 15% discount |
– Real-time market data – AI-driven trade suggestions – Customizable scanning filters |
– Excellent for active traders – AI insights for opportunities – Custom dashboards |
– Steep learning curve – Expensive subscription – Mediocre charting tools |
$89-$179/month 15% off with affiliate link |
| Finviz Visit Site |
– Auto-generated trendlines – Analyst price targets – Stock screeners and heatmaps |
– Free tools for swing traders – Easy-to-use screener – Heatmaps for market visualization |
– Delayed data on free plan – Limited crypto & forex support |
Free for basic plan Elite plan: $24-$40/month |
| TC2000 $25 discount |
– Options charting – Advanced watchlists – SmartRouting for better trade execution |
– Comprehensive charting tools – Real-time data – Customizable watchlists |
– High trading commissions – Delayed data in free version |
Free with delayed data Premium: $8-$50/month Save $25 with affiliate link |
Which Charting Platform is Best for You?
Overall, I believe that TradingView is the best charting software for stocks and all assets. However, if you already have a Schwab account, then thinkorswim may be better for you. Additionally, TrendSpider is great if you want the most charts per layout and access to an AI chatbot for ease of use.
Get Your Free Trading Resources
Grab the free trading journal template plus the same tools we use to stay organized, consistent, and objective.
- Free trading journal template
- Custom indicators, watchlists, and scanners
- Access our free trading community
Enter your email below to get instant access.
No spam. Unsubscribe anytime.


