MarketSurge Alternatives for 2026: 7 Cheaper Tools (Free Too)

MarketSurge is a great tool for CAN SLIM traders, but at $149.95 a month it costs more than many swing traders want to spend on research. I trade O’Neil-style breakouts myself, and you can rebuild most of that workflow for far less, including a set of free CAN SLIM, relative strength, Minervini and VCP scans that we publish every day. Below are seven MarketSurge alternatives (they also replace MarketSmith), what each one really covers, what they cost in November 2026, and the one thing none of them can copy.
Key Takeaways
- MarketSurge costs $149.95 a month or $1,499 a year, after a limited-time 30-day trial for $24.95. Every tool below costs less, and four have a free tier.
- No alternative has IBD’s own ratings, the IBD 50 or IBD editorial. What you can replace is the screening, the charts and the relative strength ranking.
- The cheapest full replacement is free O’Neil-style scan results plus a charting platform you already like; pay only for the piece you actually miss.
MarketSurge alternatives at a glance
Prices were checked on each company’s own pricing page on November 10, 2026. Several tools were running Black Friday sales that day, so the table shows regular prices where the vendor lists one, and the sales are noted in each section.
| Tool | Good fit for | Price (regular) | Free option |
|---|---|---|---|
| MarketSurge (IBD) | IBD ratings, IBD lists and editorial | $149.95/mo or $1,499/yr | No; 30-day trial for $24.95 |
| Financial Tech Wiz Trading Journal | Free O’Neil-style scans plus a trading journal | Free; paid $19/mo or $119/yr | Yes, free account |
| Deepvue | The closest MarketSurge-style layout | $41 to $99/mo listed; $490/yr offer until Dec 4 | No |
| TrendSpider | Automated pattern detection and backtesting | Paid plans only | No; paid trial |
| TradingView | Charts, community scripts and a broad screener | Free; paid from $12.95/mo billed yearly | Yes, Basic plan |
| TC2000 | Fast scanning with custom formulas | $24.99, $49.99 or $99.99 a month | No |
| Finviz Elite | Quick fundamental and technical filters | $39.50/mo or $299.50/yr | Yes, free Finviz |
| Stock Rover | Deep fundamentals and growth screens | $29 to $149/mo billed yearly | Yes, free plan |
Why traders look for a MarketSurge alternative
The first reason is price. IBD lists MarketSurge at $149.95 a month after a limited-time 30-day trial for $24.95, or $1,499 for a year. That is close to $1,800 a year on the monthly plan, before any data add-ons from your broker or charting platform. If you trade a small account, the subscription can eat a real share of your yearly gains before you place a trade. The r/CANSLIM thread that ranks for this search is literally titled “Cant afford Market surge”, and the replies are mostly people trading tool lists.
The second reason is overlap. Most swing traders already pay for, or use for free, a charting platform. MarketSurge is a second set of charts on top of that, and many people only open it for the ratings and a handful of screens. If that is you, you are paying a full research subscription for two features.
The third reason is workflow. MarketSurge is built around research. It does not log your trades, review your exits or show you which setups actually make you money. Plenty of CAN SLIM traders find that their weak spot is not finding stocks; it is selling too late, buying extended, or sizing up after a loss. A cheaper scanner plus a real trade journal often fixes more than a better screener would.
What MarketSurge does that no alternative copies
It is worth being honest here, because some alternatives blur this. MarketSurge is the home of IBD’s own ratings: the Composite Rating, EPS Rating, RS Rating and the rest of the IBD rating set. Those are IBD’s proprietary numbers, and no other tool shows them. Other tools, ours included, calculate their own relative strength rankings with their own formulas. They often agree with IBD on the strongest stocks, but they are not the same numbers and should never be described as IBD ratings.
MarketSurge also carries IBD content: the IBD 50, IBD lists, Leaderboard commentary and the daily market outlook. IBD’s page also highlights automatic chart pattern recognition with suggested buy points, more than 100 technical indicators and access on the web and phone apps. If you rely on IBD’s editorial judgment and its lists, no alternative replaces that, and you may be better served by keeping MarketSurge and cutting a different subscription.
What you can replace is everything else: screening for strong earnings growth and relative strength, finding stocks in Stage 2 uptrends, spotting bases and tight contractions, charting, alerts and keeping score on your own trades.
What to look for in a replacement
- Relative strength ranking. A stock’s performance ranked against the whole market, not just a raw percentage change. This is the single most useful part of the O’Neil method to keep.
- Earnings growth filters. Quarterly and annual EPS growth, ideally from reported filings rather than estimates.
- Trend and base screens. Price above rising moving averages, near 52-week highs, and tightening price action before a pivot.
- Charts you like reading. You will look at hundreds of charts a week. Speed and clarity matter more than indicator count.
- A way to review your trades. The screener finds candidates; your journal tells you whether your buys and sells work.
- A free tier or fair trial. You should be able to test the scan results against your own watchlist before paying.
7 MarketSurge alternatives compared
1. Financial Tech Wiz Trading Journal: free O’Neil-style scans plus a journal
Full disclosure first: we make the Financial Tech Wiz Trading Journal, so we have a material connection to it, and it is first on this list because it is the free starting point. I built it because I wanted the scans I use for my own swing trades and a journal in the same place.
We publish free scanner pages that follow the same ideas MarketSurge users screen for. The CAN SLIM stock screener scores stocks on six of the CAN SLIM rules and shows quarterly and three-year EPS growth from SEC filings. The RS Rating scanner lists stocks with our RS Rating of 95 or higher. Our RS Rating is our own calculation: it weights each stock’s 3, 6, 9 and 12-month returns against SPY and ranks the result from 0 to 100 across the market. It is not an IBD rating. The Minervini Trend Template scanner finds stocks that pass our version of his moving average, 52-week range and relative performance rules, the VCP scanner shows volatility contraction setups and their pivot breakouts, and the Stage 2 stocks screener lists stocks that moved from a Stage 1 base into Stage 2, ranked by Mansfield relative strength.
The free pages and the free account show final scan results that are five exchange sessions delayed. That is plenty for learning the method, checking a watchlist or studying how past setups played out, but it is not a list of what to buy today. Today’s lists, including preliminary results during the session, are part of the paid plan at $19 a month or $119 a year. Paid also adds Broker Auto Sync with 25+ brokers, the AI Trading Coach, which answers questions using your own journal data, and the Official systems with their backtests.
The journal side is what MarketSurge does not have. A free account includes manual trade entry, CSV imports and the full analytics: win rate and P&L by symbol, hold time, day of week and time of day, plus trade replay on the chart. Free accounts can also connect their own journal to an AI assistant through our MCP server (52 of 82 tools); paid gets all of them, including scanner and backtest data. You can open a free account with just an email.
Good fit for: O’Neil-style swing traders who want the scans for free and care about reviewing their own trades. Not a fit for: anyone who needs IBD’s ratings or real-time intraday scanning on a free plan.
2. Deepvue: the closest MarketSurge-style layout
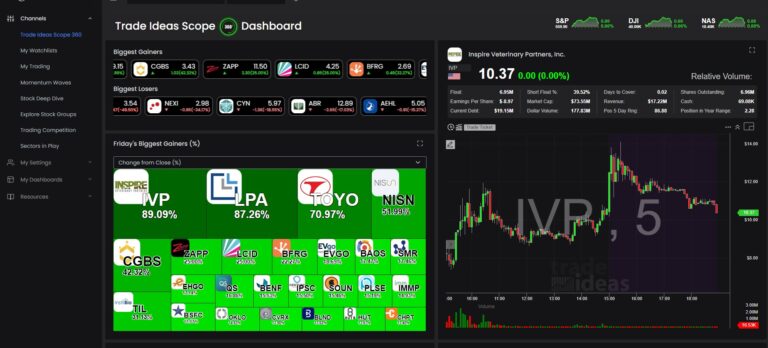
Deepvue was built for CAN SLIM and momentum traders, and it shows. The layout, data panels and screen library feel familiar if you came from MarketSmith or MarketSurge. Deepvue’s own pages disagree on its regular price: its MarketSurge comparison page lists a single plan at $49 a month, or $41 a month billed yearly, while its trading journal page lists $99 a month. On November 10, 2026 it was running a Black Friday offer of $490 for a full year, journal included, and that rate ends December 4, 2026. There is no free trial. It also has a theme tracker and an AI research feature that MarketSurge does not have.
Deepvue uses its own ratings, not IBD’s. Unlike MarketSurge, it also includes a trading journal with broker import, so it covers research and trade review in one subscription. If you want a MarketSurge replacement that looks and works the most like MarketSurge, start your comparison here. We have no affiliate relationship with Deepvue.
Good fit for: former MarketSmith users who want a familiar screen. Not a fit for: traders who want a free tier.
3. TrendSpider: automated patterns and backtesting
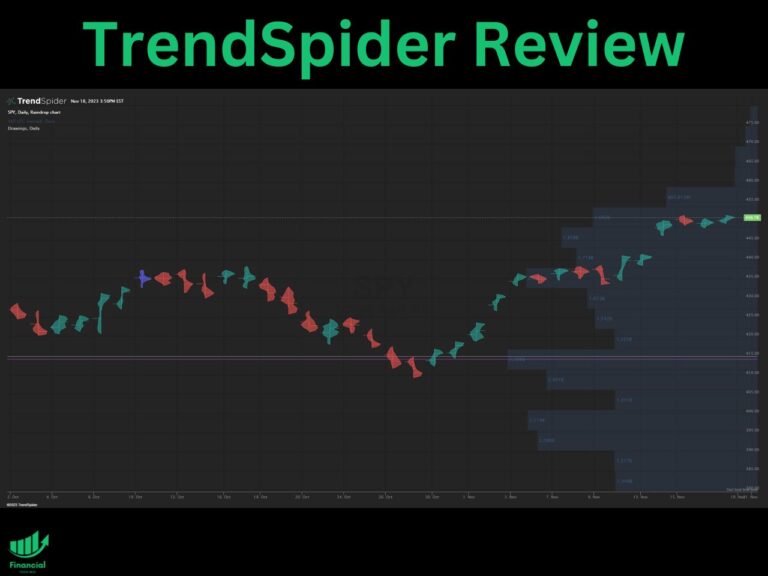
TrendSpider is the strongest pick on this list for automation. It draws trendlines automatically, detects chart patterns and candlestick patterns, runs multi-timeframe analysis and lets you backtest a strategy without code. Its scanner can run on schedules and email you results. For an O’Neil trader, the pattern detection is the closest thing to MarketSurge’s pattern recognition, and the backtester lets you test a breakout rule before you trust it. Our TrendSpider review covers the full feature set.
TrendSpider has no free plan. On November 10, 2026 its pricing page showed a Black Friday sale running through November 27: a 7-day trial for $7 and up to 65% off the first year, depending on the plan. It does not carry IBD ratings or a trade journal. You can use coupon code FTW25 for 25% off when the sale is not running.
Good fit for: traders who want automated pattern work and backtesting. Not a fit for: anyone who wants the cheapest option.
4. TradingView: charts most traders already use
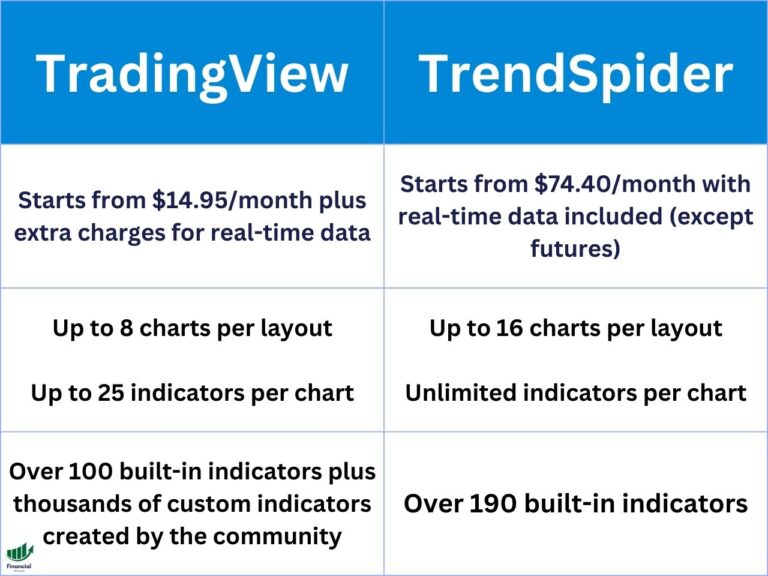
TradingView is where most swing traders already chart, so it is often the cheapest MarketSurge alternative in practice: you are replacing MarketSurge’s charts with a tool you already open. Its stock screener filters on fundamentals, performance and technicals, and its huge community script library includes plenty of free relative strength and Trend Template indicators written by other traders. Our TradingView review goes through the plans.
TradingView has a free Basic plan. Its pricing page listed paid plans starting at $12.95 a month for Essential when billed yearly on November 10, 2026. Community indicators are not IBD ratings, so treat any “RS Rating” script as that author’s own formula.
Good fit for: traders who want one charting home and are happy to build their own screens. Not a fit for: anyone who wants ready-made CAN SLIM lists without setup.
5. TC2000: fast scanning with your own formulas
TC2000 has been a favorite of momentum and growth traders for years. Its EasyScan tool lets you write scans with formulas, sort a watchlist by any column and flip through charts quickly with the keyboard, which is how many O’Neil traders actually work through a list. Our TC2000 review walks through the plans.
TC2000’s pricing page listed Basic at $24.99, Premium at $49.99 and Premium+ at $99.99 a month on November 10, 2026, with two months free on yearly billing and six months free on two-year billing. Real-time scanning and EasyScan start at Premium; Basic covers charts, watchlists and news. Through our link you get $25 off your first month with no code needed.
Good fit for: traders who like to build and tweak their own scans. Not a fit for: anyone who wants scans prebuilt for them.
6. Finviz Elite: quick filters, low price
Finviz is the quickest way to narrow the market with simple filters: EPS growth this quarter and this year, sales growth, distance from the 52-week high, moving average position and relative volume. The free version uses delayed data. Elite adds real-time data, including premarket and after hours, advanced filters, alerts and exports.
Finviz listed Elite at $39.50 a month or $299.50 a year on November 10, 2026, with a free trial. It has no relative strength ranking in the IBD sense and no pattern recognition, but a Finviz screen for growth plus a 52-week high filter gets you a workable CAN SLIM starting list fast.
Good fit for: traders who want a cheap, fast first filter. Not a fit for: anyone who wants deep chart work.
7. Stock Rover: deep fundamentals for the C and A in CAN SLIM
Stock Rover is a research platform built around fundamentals: years of financial history, growth metrics, ratings and highly customizable screeners. It is the strongest option here for the earnings side of CAN SLIM (current and annual earnings growth), and weaker on charts and chart patterns. Our Stock Rover review covers each plan.
Stock Rover has a free plan and a 14-day trial on paid plans. Billed yearly, its plans listed at $29, $49, $79 and $149 a month on November 10, 2026. A Black Friday sale that day took 30% off a first yearly or two-year term through November 30.
Good fit for: traders who weigh fundamentals heavily. Not a fit for: pure chart readers.
Feature comparison
| Tool | Relative strength ranking | EPS growth screens | Pattern detection | Trade journal |
|---|---|---|---|---|
| MarketSurge | IBD RS Rating | Yes, IBD EPS Rating | Yes, with buy points | No |
| Financial Tech Wiz Trading Journal | Our own RS Rating, 0 to 100 | Yes, CAN SLIM score from SEC filings | VCP, Darvas box, double bottom scans | Yes |
| Deepvue | Its own rating | Yes | Screens for setups | Yes |
| TrendSpider | Build your own | Yes | Yes, automated | No |
| TradingView | Community scripts | Yes | Auto chart patterns on paid plans | No |
| TC2000 | Build your own formula | Yes | No | No |
| Finviz Elite | Performance filters only | Yes | Basic chart patterns | No |
| Stock Rover | Performance metrics | Yes, deep history | No | No |
What a year of each setup costs
Monthly prices hide how far apart these tools are, so here is the yearly math at regular prices. MarketSurge on its yearly plan is $1,499. Deepvue is $490 for a year on its Black Friday offer until December 4, 2026; its own pages list $41 to $99 a month otherwise. Finviz Elite is $299.50. Stock Rover’s entry paid plan is $348 billed yearly. TC2000 Premium, the first plan with EasyScan, is about $500 billed yearly. TradingView Essential billed yearly is about $155. Our paid plan is $119 a year, and the free account costs nothing.
Most traders do not need two of these. A common low-cost pairing is one charting platform you like plus free scan results and a journal, which lands somewhere between $0 and about $275 a year. Before you buy, write down the two or three things you actually open MarketSurge for, and pay only for tools that cover those.
How to rebuild a CAN SLIM workflow for free
This is the setup I would give a friend who cannot justify $1,499 a year. It replaces the screening and review parts of MarketSurge and costs nothing until you decide you want same-day lists.
- Check the market first. O’Neil’s M rule says most stocks follow the market. Before you look at a single setup, check whether the S&P 500 and Nasdaq are in uptrends above their rising moving averages.
- Build a strength list. Start from the RS Rating and Stage 2 scan results. A stock that has led the market for months is a better candidate than one that just bounced.
- Filter for earnings. Cross that list with the CAN SLIM scan results, or with a free Finviz screen for quarterly and annual EPS growth.
- Look for a base. Open each name on a free TradingView chart. You want a proper base, such as a cup with handle or a flat base, and tightening price action. The VCP scan results do part of this work for you.
- Set alerts at the pivot. Use free price alerts on your charting platform so you are not watching screens all day.
- Journal every trade. Log the entry, the stop, the setup and the reason. After 30 trades, your win rate and average gain by setup will tell you more than any rating.
The free scan results are five sessions delayed, so use them to learn which setups the rules find and to build a watchlist, then confirm the current chart yourself. If you find you want today’s lists, that is the moment to pay, and $19 a month is still a fraction of MarketSurge. For the pattern side, our guides to the cup and handle pattern and the volatility contraction pattern explain what to look for on the chart.
MarketSurge vs MarketSmith: is it the same product?
For IBD’s US service, yes. MarketSmith was IBD’s research platform for years, IBD relaunched it under the MarketSurge name, and IBD’s old MarketSmith web addresses now forward to the MarketSurge page. If you are searching for a MarketSmith alternative in the US, every tool on this page applies. The MarketSmith name lives on elsewhere: regional versions such as MarketSmith India have their own pricing and data, and marketsmith.com now says a new MarketSmith is on the way, expected in 2027, with no details yet. Check that you are comparing the right product before you cancel anything.
Who should keep MarketSurge
Keep it if IBD’s ratings and lists are the core of how you pick stocks, if you read IBD’s market outlook every day, or if your account is large enough that $1,499 a year is a rounding error. In that case, the cheaper move is often to drop a second charting subscription instead and keep MarketSurge as your research home.
Switch if you mainly use it for screens and charts, if you already pay for TradingView, TrendSpider or TC2000, or if you are still building the habits that make the O’Neil method work. For a wider look at charting and broker tools, see our best trading platforms guide and our TradingView alternatives roundup. Most tools on this page have a free plan or a trial, so you can test the scan results against your own watchlist before you cancel anything.
Want to weigh more charting tools? Compare charting software and screeners on one page, with every review and head-to-head comparison we have published.
FAQ
Is the IBD MarketSurge worth it?
It is worth it if you use IBD’s ratings, lists and editorial every week, because no other tool has them. If you mostly use its screens and charts, a cheaper charting platform plus free CAN SLIM, RS Rating and Trend Template scan results covers most of the same ground for a fraction of $1,499 a year.
How much does MarketSurge cost?
IBD’s MarketSurge page listed $149.95 a month after a limited-time 30-day trial for $24.95, or $1,499 a year, on November 10, 2026. The yearly plan saves about $300 compared with paying monthly.
Is there a free MarketSurge alternative?
There is no free tool with IBD’s ratings. For free screening, our CAN SLIM, RS Rating, Minervini Trend Template, VCP and Stage 2 scanner pages show delayed final scan results, and you can create a free account to journal your trades. TradingView, Finviz and Stock Rover also have free plans.
Is Deepvue better than MarketSurge?
Deepvue is much cheaper: $490 for a year on its Black Friday offer until December 4, 2026, and its own pages list $41 to $99 a month otherwise. It adds a theme tracker, AI research and a trading journal. MarketSurge has IBD’s ratings, lists and editorial, which Deepvue does not. Which is better depends on whether you pay for IBD’s research or for the screening tools.
Can any alternative show IBD’s RS Rating or Composite Rating?
No. Those are IBD’s proprietary ratings. Other tools calculate their own relative strength rankings. Ours, for example, ranks each stock’s weighted 3, 6, 9 and 12-month returns against SPY from 0 to 100. The idea is similar, but the numbers are not IBD’s.
Financial Tech Wiz / Free resources
Build a clearer picture of your trading.
Start with a free journal account. Keep your trades organized, review your results, and build a consistent review routine.
Your free journal account includes the template and tools by email:
- Free Google Sheets and Excel trading journal template
- Indicators, watchlists, and scanners
- Access to the free trading community
Ready for automatic trade tracking? Explore the Financial Tech Wiz Trading Journal.
Free journal. No card needed.