SMA vs. EMA vs. WMA: Which Moving Average Should You Use?

Moving averages are the most widely used technical indicators in trading. The difference between SMA, EMA, and WMA comes down to how each type weights price data and how quickly it responds to new market information. Choosing the right one depends on your trading style, the timeframe you are operating on, and whether you are scanning for short-term momentum crossovers or long-term institutional trend support.
Key Takeaways
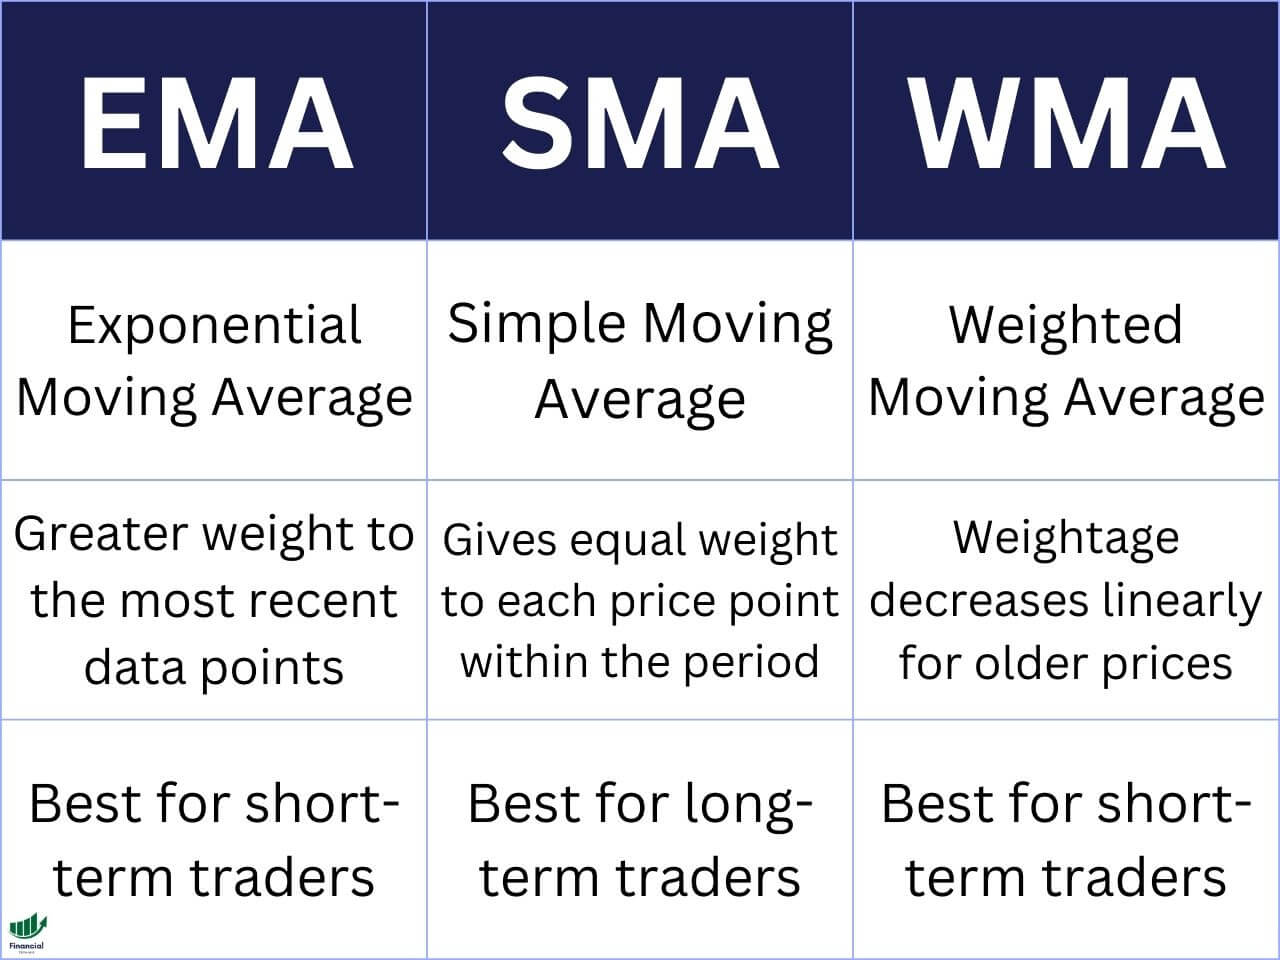
- MA vs. SMA vs. EMA vs. WMA: Moving Average (MA) is the umbrella term; Simple Moving Average (SMA) weights all bars equally, Exponential Moving Average (EMA) weights recent bars exponentially, and Weighted Moving Average (WMA) weights recent bars linearly.
- Best use cases by style: Day traders and swing traders favor the 9 EMA and 21 EMA for fast crossover signals, while position traders rely on the 50-day and 200-day SMAs for Golden Crosses and Stage 2 trend structure.
- Done-for-you moving average scans: Instead of building crossover filters manually, you can open our pre-built 9/21 EMA Crossover scanner, Golden Cross screener, and Death Cross screener on the free stock scanners hub.
SMA vs. EMA vs. WMA: Side-by-Side Comparison
| Feature | SMA (Simple) | EMA (Exponential) | WMA (Weighted) |
|---|---|---|---|
| Weighting | Equal across all bars | Exponential multiplier on recent bars | Linear countdown weight |
| Responsiveness | Slowest (smooths noise) | Fastest on initial price shocks | Fast in steady trends |
| False Signals | Fewest | More in choppy ranges | Moderate |
| Best For | Long-term trends (50 / 200 SMA) | Day & swing trading (9 / 21 EMA) | Tight linear trend tracking |
| Pre-Built Scanner | Golden Cross Screener | 9/21 EMA Scanner | Free Stock Scanners Hub |
What Is a Moving Average (MA)?
A moving average (MA) is a technical indicator that smooths price data by calculating a continuously updated average price over a defined time period. It removes short-term noise from a price chart, making the underlying trend easier to read.
Moving averages are lagging indicators. They are calculated using past price data, so they confirm trends rather than predict them. This is why the differences between MA types matter: the faster an indicator reacts to price, the sooner you get a signal, but the more false signals you will encounter.
Because MAs confirm trend direction but do not measure momentum, most traders pair them with a momentum oscillator. The RSI on TradingView (or our pre-built RSI scanner) is the most common choice: the MA tells you which direction to trade, and the RSI tells you when price is stretched enough to offer a high-probability entry or exit.
The three most common types are the Simple Moving Average (SMA), the Exponential Moving Average (EMA), and the Weighted Moving Average (WMA).
EMA vs. MA Compared
Traders frequently search for “EMA vs. MA” because many charting platforms label their default Simple Moving Average simply as “MA.” In strictly technical terms, MA (Moving Average) is the general category that includes SMA, EMA, WMA, and Hull Moving Averages, while on platforms like TradingView and thinkorswim the plain “MA” indicator defaults to an equal-weighted Simple Moving Average. Compared to a standard MA (SMA), the EMA applies an exponential smoothing multiplier that weights the most recent candles much more heavily, causing the EMA line to hug price closer and turn earlier on reversals.
SMA vs. EMA Compared
SMA and EMA are both types of moving averages but differ in their calculation. The SMA assigns equal weight to all values in the lookback window, while the EMA gives exponentially more weight to recent data, offering a quicker response to price changes.
SMA vs. MA Compared
The SMA is a specific type of MA that calculates the arithmetic average price over a set period without weighting. In contrast, other MAs, like the EMA and WMA, apply mathematical multipliers so recent bars matter more than older bars.
WMA vs. EMA Compared
Both WMA and EMA give more importance to recent data but differ in their decay curve. The WMA uses a linear weighting method (where weights step down evenly by 1 each bar and drop to zero outside the window), while the EMA uses an exponential multiplier that reacts immediately to sudden price spikes while retaining a small tail of historical data.
What Is the Simple Moving Average (SMA)?
The SMA is the most straightforward moving average. It calculates the arithmetic mean of closing prices over a set number of periods. Every price point in the lookback window receives equal weight.
Formula: SMA = (Sum of closing prices) / (Number of periods)
For example, a 10-day SMA adds the last 10 closing prices and divides by 10. When a new day closes, the oldest price drops off and the newest price is added.
Common SMA Settings and Pre-Built Scanners
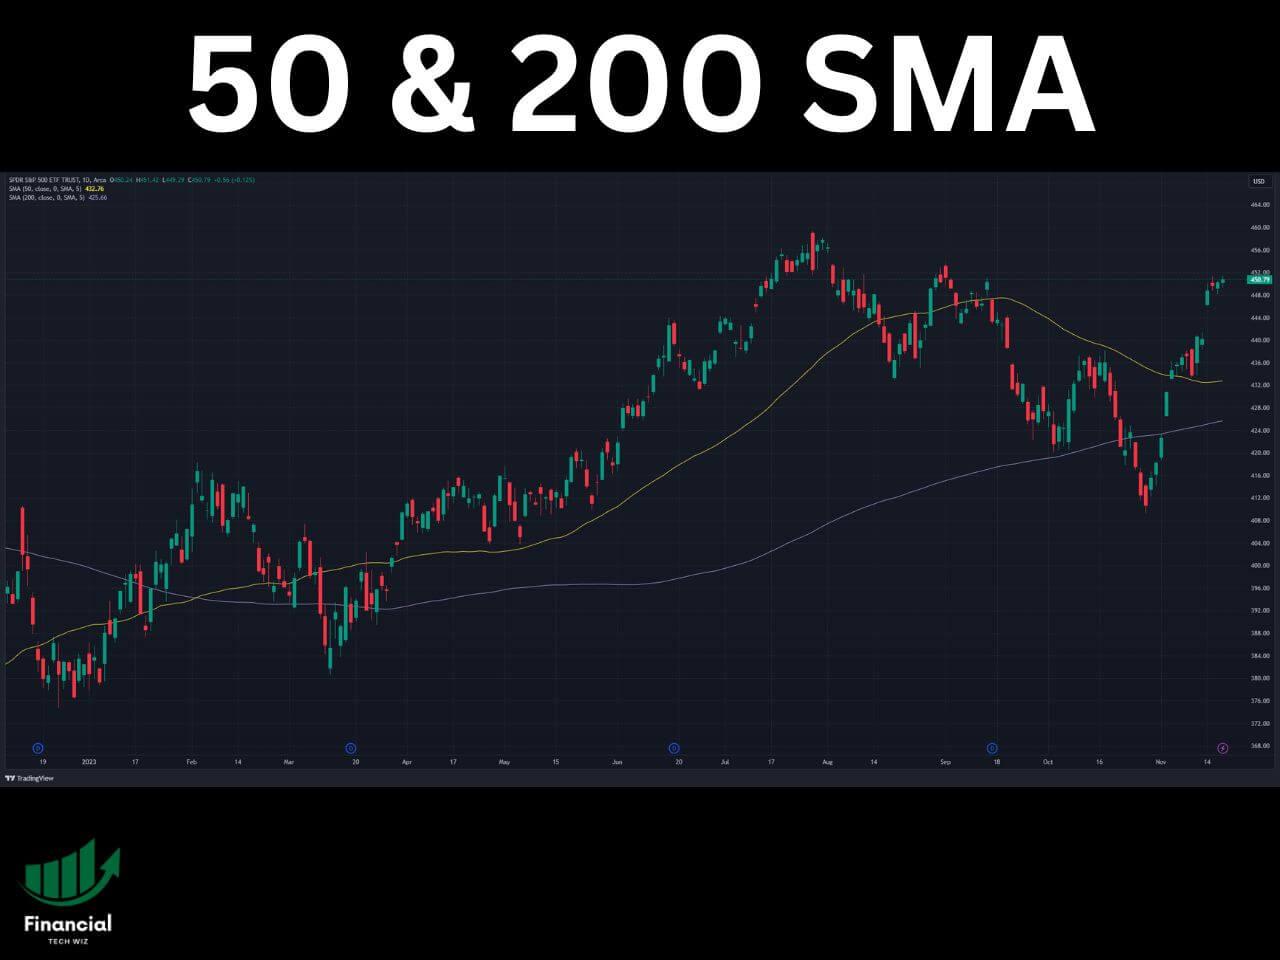
- 50-day SMA: Standard medium-term institutional support and trend filter used in Stage 2 uptrend analysis.
- 200-day SMA: Widely watched by institutional funds as the dividing line between long-term bull and bear regimes, and a core filter in the Minervini Trend Template scanner.
When the 50-day SMA crosses above the 200-day SMA, traders call this a golden cross, which is considered a major long-term bullish transition. The reverse crossing (50-day SMA crossing below the 200-day SMA) is a death cross. You can view every US stock triggering these signals today on our pre-built Golden Cross screener and Death Cross screener.
Best for: Long-term investors, position traders, and swing traders analyzing broader market structure.
Limitation: The SMA responds slowly to recent price changes. In fast-moving markets this lag can produce late entries and exits.
What Is the Exponential Moving Average (EMA)?
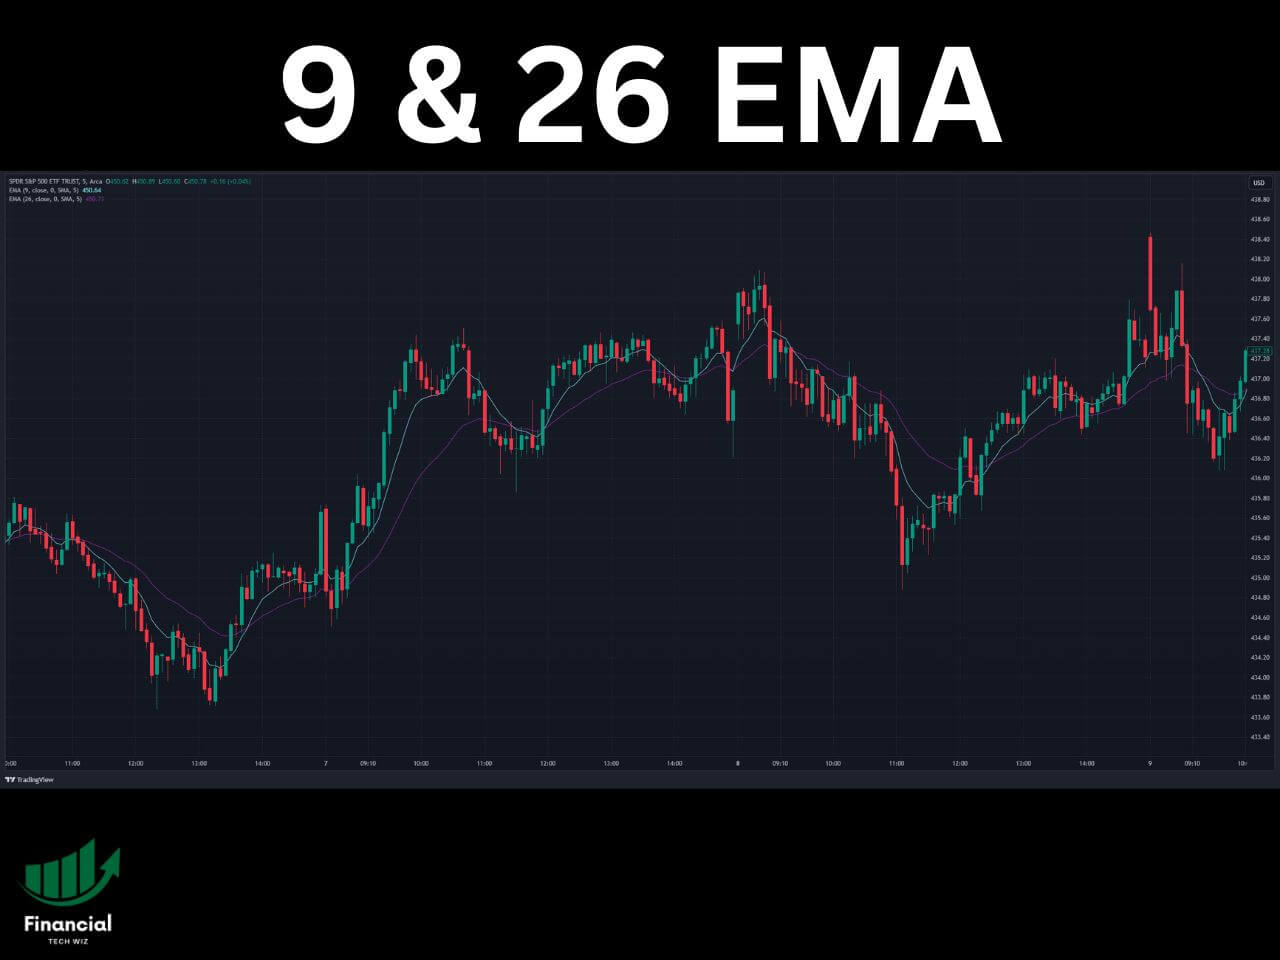
The EMA applies a multiplier that gives more weight to recent prices. The smoothing factor is 2 / (n + 1), where n is the period length: the shorter the period, the more weight the most recent price receives.
This makes the EMA faster to react to price changes than the SMA, which is why short-term and swing traders prefer it. The tradeoff is greater sensitivity to price noise and more frequent false signals in choppy, range-bound markets.
Common EMA Settings and Pre-Built Scanners
- 9 EMA: Popular with day traders and momentum swing traders for riding fast breakouts.
- 21 EMA: Standard swing trading pullback and trend-continuation reference point.
- 12 and 26 EMA: The underlying moving averages used to calculate the MACD indicator.
When the 9 EMA crosses above the 21 EMA on a daily or intraday chart, momentum traders treat this as a short-term bullish crossover signal. Instead of building this scan manually, you can check our pre-built 9/21 EMA Crossover scanner for daily charted matches, or learn how to configure custom lengths on your chart in our TradingView moving average guide.
Best for: Day traders, scalpers, and short-term swing traders who need faster signals than the SMA provides.
What Is the Weighted Moving Average (WMA)?
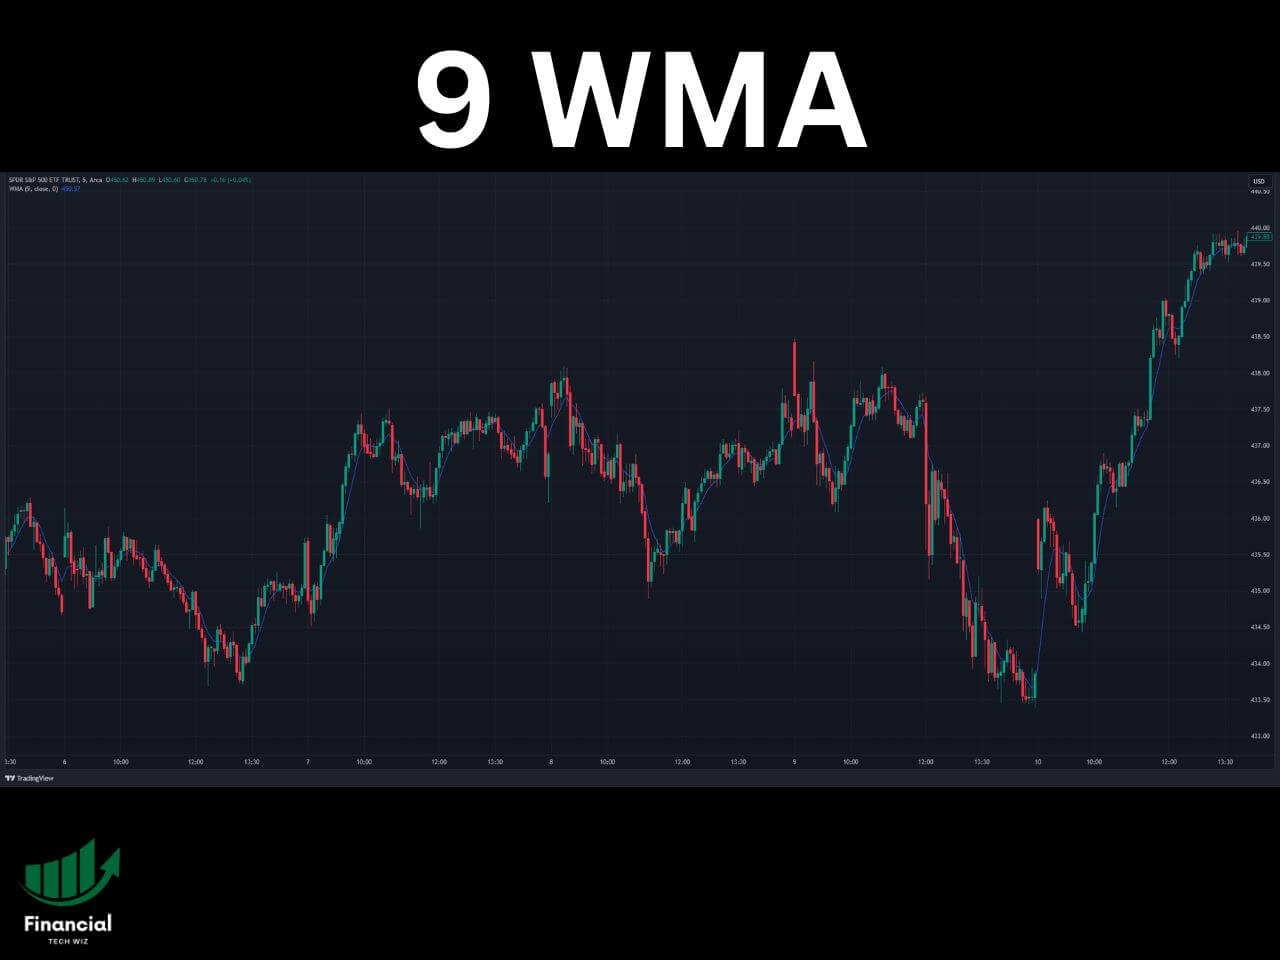
The WMA also prioritizes recent price data but uses a linear weighting system rather than exponential smoothing. The most recent period gets the highest weight, the second most recent gets the next highest, and so on in a straight-line decline.
Formula: WMA = (Price1 x n + Price2 x (n-1) + … + PriceN x 1) / (n x (n+1) / 2)
For a 3-period WMA, the most recent price gets a weight of 3, the second most recent gets 2, and the oldest gets 1. This makes it more responsive than the SMA while dropping old prices completely once they leave the lookback window.
The WMA is less common as a standalone line than the SMA or EMA, though it serves as the core building block inside the Hull Moving Average (HMA) for ultra-low-lag trend tracking.
Best for: Traders who want a responsive linear alternative to the SMA without the infinite historical tail of the EMA.
Which Moving Average Is Best for Day Trading?
For day trading, the EMA is the standard choice. The 9 EMA and 21 EMA combination is the most common for intraday entries and exits, while many scalpers also pair the 9 EMA with VWAP.
The reasoning is direct: faster reaction to price changes produces earlier signals, which matters on 1-minute to 15-minute charts where delayed signals mean missed trades or poor fill prices.
If you want to monitor multiple timeframes simultaneously to confirm EMA signals across different time horizons, TradingView’s multiple chart layout feature lets you view up to eight charts on one screen.
For long-term or swing analysis, the 50-day and 200-day SMAs remain the more reliable institutional reference because they filter short-term noise better than short-period EMAs.
How to Use Moving Averages to Trade Effectively
Moving averages serve three primary roles in a structured trading system: trend filtering, dynamic support and resistance, and crossover triggers.
Moving averages define the trend context that makes chart patterns readable: a bull flag or VCP forming above a rising 21 EMA and 50 SMA carries much higher institutional support than the same formation inside a choppy range.
Traders also use two moving averages together for a crossover strategy (such as the 9/21 EMA crossover for swing momentum or the 50/200 SMA Golden Cross for macro trend shifts), or use cloud-based equilibrium lines via the Ichimoku Cloud crossover scanner.
Once you are trading live with a moving average strategy, log every entry and exit in the Financial Tech Wiz Trading Journal (a free account is enough to start) with the MA setup tagged so you can see which lengths and timeframes actually produce positive expectancy in your own data.
Financial Tech Wiz / Free resources
Build a clearer picture of your trading.
Start with a free journal account. Keep your trades organized, review your results, and build a consistent review routine.
Your free journal account includes the template and tools by email:
- Free Google Sheets and Excel trading journal template
- Indicators, watchlists, and scanners
- Access to the free trading community
Ready for automatic trade tracking? Explore the Financial Tech Wiz Trading Journal.
Free journal. No card needed.
The Best Lengths for Moving Averages
The best length for a moving average depends on the trader’s objectives and the market’s volatility:
- Short-term momentum (9 EMA & 21 EMA): Captures 1-to-3 week swing bursts and intraday trend continuation.
- Intermediate trend (50 SMA): The primary institutional support line for Stage 2 growth stocks during healthy pullbacks.
- Long-term regime filter (150 SMA & 200 SMA): Defines the macro uptrend or downtrend and anchors the Minervini 8-Point Trend Template.
How to Access Moving Averages on TradingView
TradingView supports all three moving average types on its free and paid plans. To add them to a chart:
- Open a chart and click the Indicators button at the top toolbar.
- Search for Moving Average Simple, Moving Average Exponential, or Moving Average Weighted.
- Select the indicator and adjust the length in the settings panel.
If you have not used TradingView before, you can review what the free plan and 30-day trial include in our TradingView free trial overview, and explore companion indicators in our guide to the best TradingView indicators.
MA vs. EMA vs. SMA vs. WMA: Bottom Line
Each moving average (MA, EMA, SMA, and WMA) serves a distinct purpose. Use the 9 EMA and 21 EMA when speed and early crossover triggers matter most, and use the 50 SMA and 200 SMA when you want institutional trend confirmation with fewer false signals.
To skip manual filter setup and see which stocks are crossing key moving averages right now, check our free stock scanners hub, and compare performance-tracking platforms in our roundup of the best trading journals of 2026.
Frequently Asked Questions
What is the difference between SMA and EMA?
The SMA assigns equal weight to all price data in the period. The EMA gives more weight to recent prices using an exponential multiplier. This makes the EMA faster to react to price changes and more useful for short-term trading, while the SMA is better suited to long-term trend analysis where stability matters more than speed.
Which moving average is best for swing trading?
Most swing traders use the EMA, particularly the 21 EMA or a combination of the 9 and 21 EMAs (which you can track automatically on our 9/21 EMA Crossover scanner). Many swing traders also pair shorter-period EMAs with the 50-day and 200-day SMAs as broader Stage 2 trend filters.
Is WMA better than EMA?
Neither is universally better; they weight recent prices differently. The WMA uses linear countdown weighting and drops older bars completely once they exit the lookback window, while the EMA uses exponential smoothing that reacts faster to sudden 1-to-2 bar price shocks. Most active equity and forex traders default to the EMA for short-term momentum.
Financial Tech Wiz / Free resources
Build a clearer picture of your trading.
Start with a free journal account. Keep your trades organized, review your results, and build a consistent review routine.
Your free journal account includes the template and tools by email:
- Free Google Sheets and Excel trading journal template
- Indicators, watchlists, and scanners
- Access to the free trading community
Ready for automatic trade tracking? Explore the Financial Tech Wiz Trading Journal.
Free journal. No card needed.