Best Stock Screener for Swing Trading (2026): 6 Tools Compared

Most “best screener” lists are written by the companies that sell one, and most of the tools on them were built for day traders watching a level two screen. Swing traders need something different: a short list of strong stocks after the close, a chart that shows why each one made the list, and a way to check later whether the setups you took actually paid. This guide compares six screeners for that job, with the exact scans I run and the settings to copy into each tool.
Key Takeaways
- A swing trading screener should run on the daily close, rank stocks by relative strength and find bases and pullbacks; real-time streaming matters far less than it does for day trading.
- TradingView and Finviz cover most needs for free; TrendSpider and TC2000 add pattern recognition and custom formulas; Stock Rover is the pick for fundamental filters.
- The Financial Tech Wiz Trading Journal (we make it) runs O’Neil and Minervini style scans for you and keeps the trades you take from them in one journal.
Disclosure: we make the Financial Tech Wiz Trading Journal, so it is our own product in this list. Some buttons below are affiliate links, and Financial Tech Wiz may earn a commission if you buy through them, at no extra cost to you. That never decides where a tool lands; each one is here for the swing trading job it does well.
What makes a stock screener good for swing trading
I trade swing setups in the style William O’Neil and Mark Minervini made popular: buy leading stocks as they break out of a sound base, cut losses fast, and let the winners run for weeks. That style asks very little of a screener during the trading day and a lot of it after the close. Here is what actually matters.
End of day data you can trust
A swing trade is planned the night before. You want the screen to run on the completed daily bar, with correct volume, so the list you build at 8 PM is the list you act on at the open. Real-time streaming scans are nice to have, but they mostly serve day traders. If a vendor’s headline feature is “real-time”, ask yourself whether you would actually trade a stock that showed up at 11:14 AM.
Relative strength ranking
The most useful single filter for this style is relative strength: how a stock’s price performance over the past year ranks against every other stock. Leaders before a big move usually rank in the top 20 to 30 percent of the market. A good screener either calculates a percentile rank for you or lets you build one from 3, 6 and 12 month returns.
Trend and moving average filters
Stacked moving averages (price above the 50, 150 and 200 day lines, with the 200 day rising) remove most of the stocks you should not be buying. Every tool in this list can do it, but some make it a one-click preset and others need a formula.
Base and pattern detection
Finding a volatility contraction, a flat base or a cup with handle by eye across 5,000 charts is not realistic. Pattern recognition, or at least a tightness filter (shrinking range and volume near a high), saves hours each week.
Charts and a way to review results
A screen gives you a list; the chart tells you whether the setup is real. After that comes the step almost every list skips: tracking which scans led to trades that worked. Without that record you never learn which screen deserves your attention.
The six screeners at a glance
Prices are from each company’s own pricing page, checked November 10, 2026. Several vendors were running Black Friday sales that day, so the sale price you see may be lower.
| Screener | Best for | Free option | Paid price | Swing trading strength |
|---|---|---|---|---|
| Financial Tech Wiz Trading Journal | Prebuilt O’Neil and Minervini scans plus a journal | Yes: free account, scan results five sessions delayed | $19/month or $119/year | Trend Template, VCP, Stage 2, RS Rating, CAN SLIM scans run for you each night |
| TradingView | Charts and a flexible free screener | Yes: Basic plan | From $14.95/month (Essential) | Huge filter set, alerts, the charts most traders already use |
| Finviz | Fast free filters and heat maps | Yes: free screener with delayed quotes | Elite $39.50/month or $299.50/year | Quick technical presets, pattern filters, simple setup |
| TrendSpider | Automated pattern and trendline detection | No free plan; 7-day trial ($7 during its sale) | Standard, Premium, Enhanced and Advanced plans; Black Friday sale through Nov 27 | Pattern recognition, multi-timeframe scans, backtesting |
| TC2000 | Custom formula scans and fast charts | None listed on its pricing page | Basic $24.99, Premium $49.99, Premium+ $99.99 per month | Personal Criteria Formulas, EasyScan, scan history columns (Premium and up) |
| Stock Rover | Fundamental and growth filters | Yes: free plan | From $29/month billed yearly; Black Friday 30% off a first annual term through Nov 30 | Earnings growth, margins and ratings to pair with a chart tool |
1. Financial Tech Wiz Trading Journal: prebuilt swing scans plus a journal
We make this one, so weigh my view accordingly. I built it because I was tired of rebuilding the same O’Neil and Minervini screens in four different tools, then losing track of which list a trade came from. Instead of handing you 200 filters, it runs a set of named swing trading scans on every US stock after each close and shows the results with a chart that marks why each stock qualified.
The scans that matter most for swing traders:
- The Minervini Trend Template scanner: price above rising 50, 150 and 200 day averages, at least 30% above the 52-week low, within 25% of the high, and a relative strength percentile above 70.
- The VCP scanner: stocks whose pullbacks get smaller and quieter inside a base, the volatility contraction pattern.
- The Stage 2 stocks screener: stocks in Stan Weinstein’s Stage 2, the advancing phase after a base.
- The relative strength scanner: lists stocks with our own RS Rating of 95 or higher. The rating weights each stock’s 3, 6, 9 and 12-month returns against SPY and ranks the result from 0 to 100 across US stocks. It is our calculation, not an IBD rating.
- The CAN SLIM stock screener and the Darvas box screener for growth leaders and tight boxes near highs.
- The Daily Pivot breakout scanner and the Power Earnings Gap scanner for stocks moving out of a base or gapping up on earnings.
- The Daily Dip scanner and the 9/21 EMA crossover scanner for pullback entries inside an uptrend.
All of them, plus the rest of our 18 free scanners, are on the free stock scanners page.
What is free and what is paid matters here, so plainly: the free scanner pages and a free account show final scan results that are five exchange sessions delayed. That is useful for learning what each setup looks like and for studying how past results played out, but it is not a list to trade tomorrow. Today’s scan results, including preliminary lists during the session, are part of the paid plan ($19 a month or $119 a year), along with the tested Official systems and their stored backtests, Broker Auto Sync with 25+ brokers and the AI Trading Coach, which answers questions using your own journal data.
Because every scan runs on the daily close, this is a swing and position trading tool. Do not use it for intraday breakouts or opening range trades; it is not built for that.
The part no other screener here does is the journal. A trade you take from a scan sits next to your other trades, so the analytics show your win rate and P&L by symbol, hold time, day and time of day, and you can tag trades by setup to see which scan you trade best. A free account also lets you connect your own journal to an AI assistant over MCP (52 of the 82 tools); the paid plan opens all of them, including scanner and system data.
Weak spots: there is no custom formula builder, so if you want to invent your own screen from scratch, pair it with TradingView or TC2000. It covers US stocks only.
2. TradingView: the free screener most swing traders already have
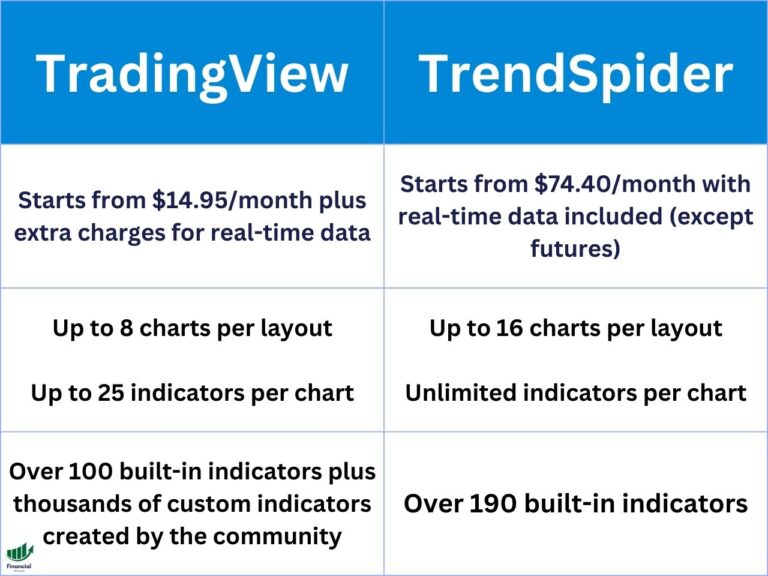
TradingView’s stock screener is free on the Basic plan and covers stocks, ETFs, bonds and crypto across more than 150 exchanges. Filters include moving averages, performance over any period, relative volume, technical ratings and fundamentals, and any result opens straight into the charts most traders already use. Paid plans start at $14.95 a month (Essential, or $12.95 a month billed annually) and add more watchlist space, more indicators per chart and more alerts; data export needs Plus or higher.
For swing trading it does the core job well: a trend screen (price above the 50 and 200 day averages, 50 above 200), a performance sort and a quick chart review cover most nights. What it lacks is a built-in relative strength percentile and base detection, so you approximate them with 3, 6 and 12 month performance columns. Our TradingView stock screener guide walks through every filter.
Best for: traders who want one free place for charts and screens. Skip it if you want patterns found for you.
3. Finviz: the quickest free filters
Finviz is the screener half the swing trading threads on Reddit mention first, and for good reason: it is fast, free and simple. Dropdown filters cover moving averages, new highs, RSI, relative volume, gaps and chart patterns such as channels, wedges and double bottoms. The free version uses delayed quotes, which is fine for an end of day routine. Finviz Elite costs $39.50 a month or $299.50 a year ($24.96 a month billed annually) and adds real-time quotes and charts, screener alerts, exports and an ad-free interface.
Its limits for an O’Neil style trader: performance filters come in fixed buckets, so there is no true relative strength ranking, and charts are basic. Many traders screen in Finviz and chart in TradingView; our TradingView vs Finviz comparison covers that split.
Best for: a fast free first pass. Skip it if you want ranked lists or deep charting.
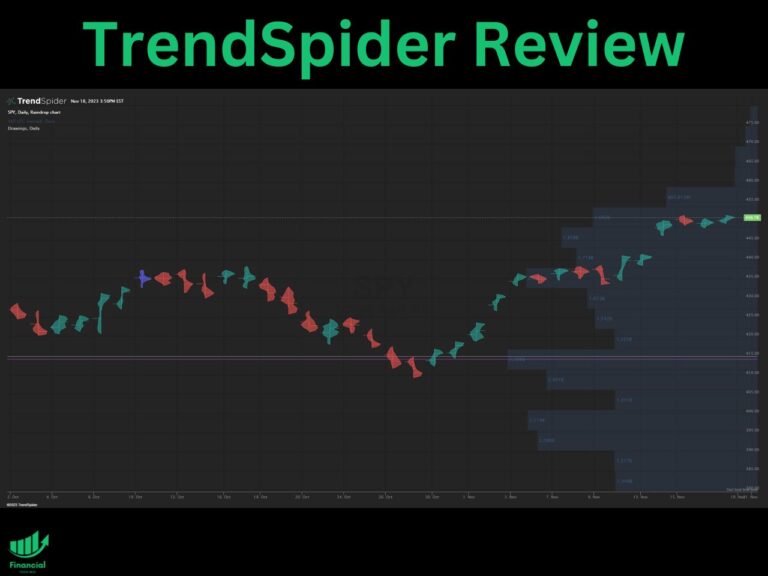
4. TrendSpider: pattern recognition done for you
TrendSpider’s pitch is automation: it draws trendlines, finds candlestick and chart patterns and runs multi-timeframe scans, so a weekly uptrend plus a daily pullback becomes one scan instead of two. Scans can be turned into alerts and backtested, which helps you test a screen before you trust it. Every plan (Standard, Premium, Enhanced and Advanced) includes all features; the plans differ in capacity and support. On November 10, 2026 its pricing page showed a 7-day trial for $7 and up to 65% off the first year through November 15, the first stage of a Black Friday sale that runs through November 27. Our TrendSpider review goes deeper.
Best for: swing traders who want bases and trendline breaks found automatically and are willing to pay for it. Skip it if a free screen already covers your routine.
5. TC2000: custom formulas and scan history
TC2000 has been an O’Neil style trader’s tool for decades. Its Personal Criteria Formulas let you write any condition (for example, closing price within 5% of the 52-week high with volume drying up) and then sort the whole market by it. History columns show how a scan looked last night or at the start of the year, which is handy for studying how leaders behaved before their moves. Monthly prices on its pricing page are Basic $24.99, Premium $49.99 and Premium+ $99.99, with two months free on yearly billing. Scanning, Personal Criteria Formulas, EasyScan and history columns start at Premium; Basic covers charts, watchlists and news, so budget for Premium if you want to screen. Read our TC2000 review for the plan details.
Best for: traders who like to build their own screens and want fast charts on Windows or Mac. Skip it if you would rather pick from prebuilt scans.
6. Stock Rover: the fundamental half of CAN SLIM
O’Neil’s method is half chart, half fundamentals: current and annual earnings growth, sales growth, margins and institutional demand. Stock Rover is the strongest tool here for that half. Its screener has hundreds of fundamental metrics and growth histories, a free plan to start, and four paid plans (Premium, Premium Plus, Ultimate and Ultimate Pro) from $29 a month billed yearly. On November 10, 2026 its pricing page advertised 30% off a first annual or two-year term for Black Friday, through November 30. Charting is not its strength, so pair it with one of the chart-first tools above. Our Stock Rover review covers each plan.
Best for: growth investors and CAN SLIM traders who want earnings filters. Skip it if you only trade the chart.
What about day trading scanners?
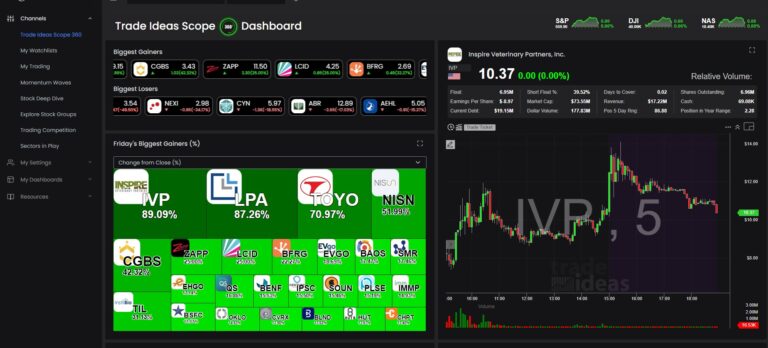
Tools such as Trade Ideas and real-time momentum scanners are built to catch stocks moving right now, with streaming alerts every few seconds. They are excellent at that, and expensive for it. A swing trader who plans entries the night before pays for speed they rarely use, so I left them out of this list. If you trade both styles, keep the day trading scanner for the session and use one of the tools above for your swing watchlist.
Swing trading screener settings you can copy
These are the screens I run, written so you can build them in any of the tools above. Each one finds candidates, not trades: always check the chart, the market trend and your risk before you buy.
Trend Template leaders
- Price above the 50, 150 and 200 day simple moving averages.
- 50 day above 150 day, and 150 day above 200 day.
- 200 day average higher than it was a month ago.
- Price at least 30% above the 52-week low and within 25% of the 52-week high.
- Relative strength in the top 30% of the market (in Finviz or TradingView, sort by 6 and 12 month performance instead).
- Average daily volume above 300,000 shares and price above $10, so fills are clean.
This is the screen behind Minervini’s approach; our Mark Minervini trading strategy guide explains why each rule is there.
Tight bases near highs (VCP style)
- Start from the Trend Template list above.
- Price within 10% of the 52-week high.
- 10-day average true range lower than the 50-day average true range (the range is tightening).
- 10-day average volume below the 50-day average volume (sellers are drying up).
Then look at the chart for two to four pullbacks, each smaller than the one before. The volatility contraction pattern guide shows what a clean one looks like.
Breakouts on volume
- Close at a new 20-day or 52-week high.
- Volume at least 1.5 times the 50-day average.
- Close in the upper half of the day’s range.
- Price above the 50 day average, with the market itself above its 50 day line.
Pullbacks in an uptrend
- Price above a rising 50 day average.
- Close within 3% of the 21 day exponential moving average, or the 9 day EMA crossing back above the 21 day EMA.
- RSI(14) between 40 and 55 (cooled off, not broken).
- Volume on the pullback days below average.
Pullback entries give a tighter stop than breakouts, at the cost of missing the strongest names that never pull back. I run both and let the market tell me which is working.
From screen to trade: a nightly routine
A screener only helps if you use it the same way every night. This is the routine I follow, and it takes about 30 minutes once it is habit.
- Check the market first. If the S&P 500 is below its 50 day average and falling, I cut position sizes or sit out; most breakouts fail in a weak tape.
- Run the trend screen and sort by relative strength. Keep the top 30 to 50 names.
- Flip through the charts fast. Delete anything extended more than 5% above a proper buy point or without a clear base.
- Write down the trigger price, the stop and the share size for the five to ten names left. I risk a fixed percent of the account per trade, so the stop sets the size.
- Set alerts at the trigger prices and walk away. The screen did its job; the plan does the rest tomorrow.
- Log every trade you take, with the scan it came from. After 30 or 40 trades the numbers show which setups earn their place on your list.
Step six is where most traders stop, and it is the one that compounds. A free account in the Financial Tech Wiz Trading Journal handles it, and our best trading journals roundup compares other options if you want one.
Which screener should you pick?
- You want ready-made O’Neil and Minervini scans and a journal in one place: the Financial Tech Wiz Trading Journal.
- You want free charts and a flexible screener: TradingView.
- You want the fastest free filters: Finviz.
- You want patterns and trendlines found automatically: TrendSpider.
- You want to write your own formulas: TC2000.
- You want earnings and growth filters: Stock Rover, paired with a chart tool.
Most swing traders end up with two tools: one to find stocks and one to chart and trade them. If you are still choosing where to place the trades themselves, our best trading platforms guide sorts brokers by trading style.
Looking at other charting tools too? Compare charting platforms and stock screeners on one page, with all our reviews and head-to-heads.
FAQ
What is the best screener for swing trading?
It depends on how you trade. TradingView and Finviz are the strongest free choices for building your own screens. TrendSpider is the pick for automatic pattern detection, TC2000 for custom formulas and Stock Rover for fundamentals. If you trade O’Neil or Minervini style setups and want the scans built for you, the Financial Tech Wiz Trading Journal (our product) runs them each night.
What is the best free stock screener for swing trading?
TradingView’s Basic plan and the free version of Finviz both cover trend, volume and performance filters at no cost. Our free scanner pages add prebuilt Trend Template, VCP, Stage 2 and relative strength scans, with results that are five exchange sessions delayed; today’s lists need the paid plan.
What is the best tool for swing trading?
Three tools do most of the work: a screener to find candidates, a charting platform to judge them and a journal to track what you trade. Many traders use TradingView for the first two and a trading journal for the third.
Do I need real-time data to swing trade?
Not for screening. Swing setups are found on the daily close and planned before the next open, so end of day data is enough. Real-time quotes help when you place the order, and your broker already provides those.
What are good swing trading screener settings?
Start with trend: price above rising 50 and 200 day averages, within 25% of the 52-week high, with relative strength in the top 30% of the market, average volume above 300,000 shares and price above $10. Then narrow to tight bases or pullbacks to the 21 day EMA, as in the settings section above.
Financial Tech Wiz / Free resources
Build a clearer picture of your trading.
Start with a free journal account. Keep your trades organized, review your results, and build a consistent review routine.
Your free journal account includes the template and tools by email:
- Free Google Sheets and Excel trading journal template
- Indicators, watchlists, and scanners
- Access to the free trading community
Ready for automatic trade tracking? Explore the Financial Tech Wiz Trading Journal.
Free journal. No card needed.