TradingView is a popular online platform for traders and investors to analyze financial markets with charts and fundamental data.
The free version of TradingView is great and offers nearly real-time data for major stocks and ETFs like SPY and AAPL. Plus, you can use it to chart all markets, including stocks, ETFs, futures, crypto, forex, and more, making it a one-stop shop for all types of traders.
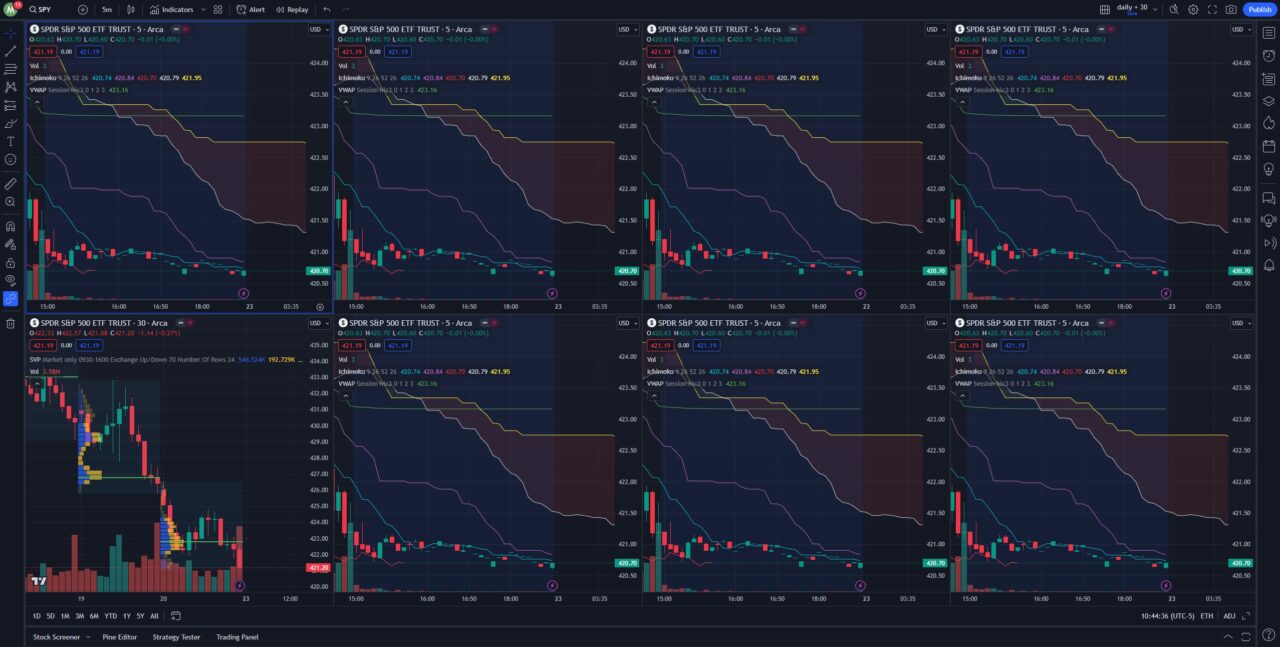
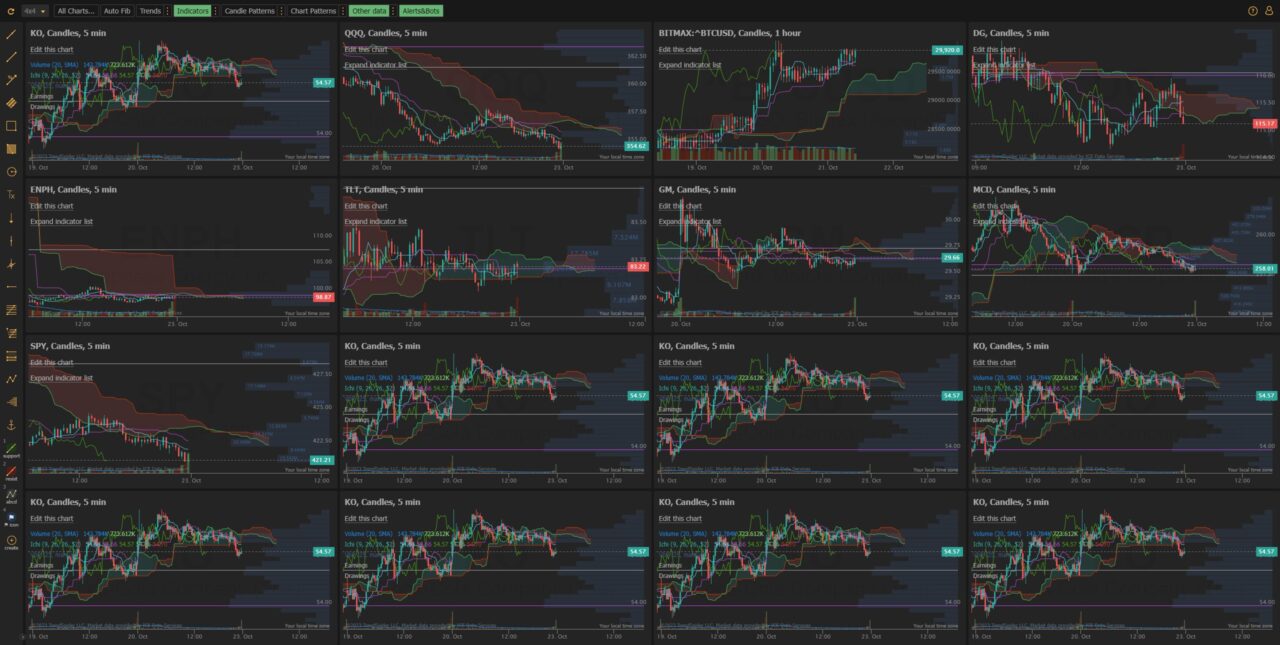
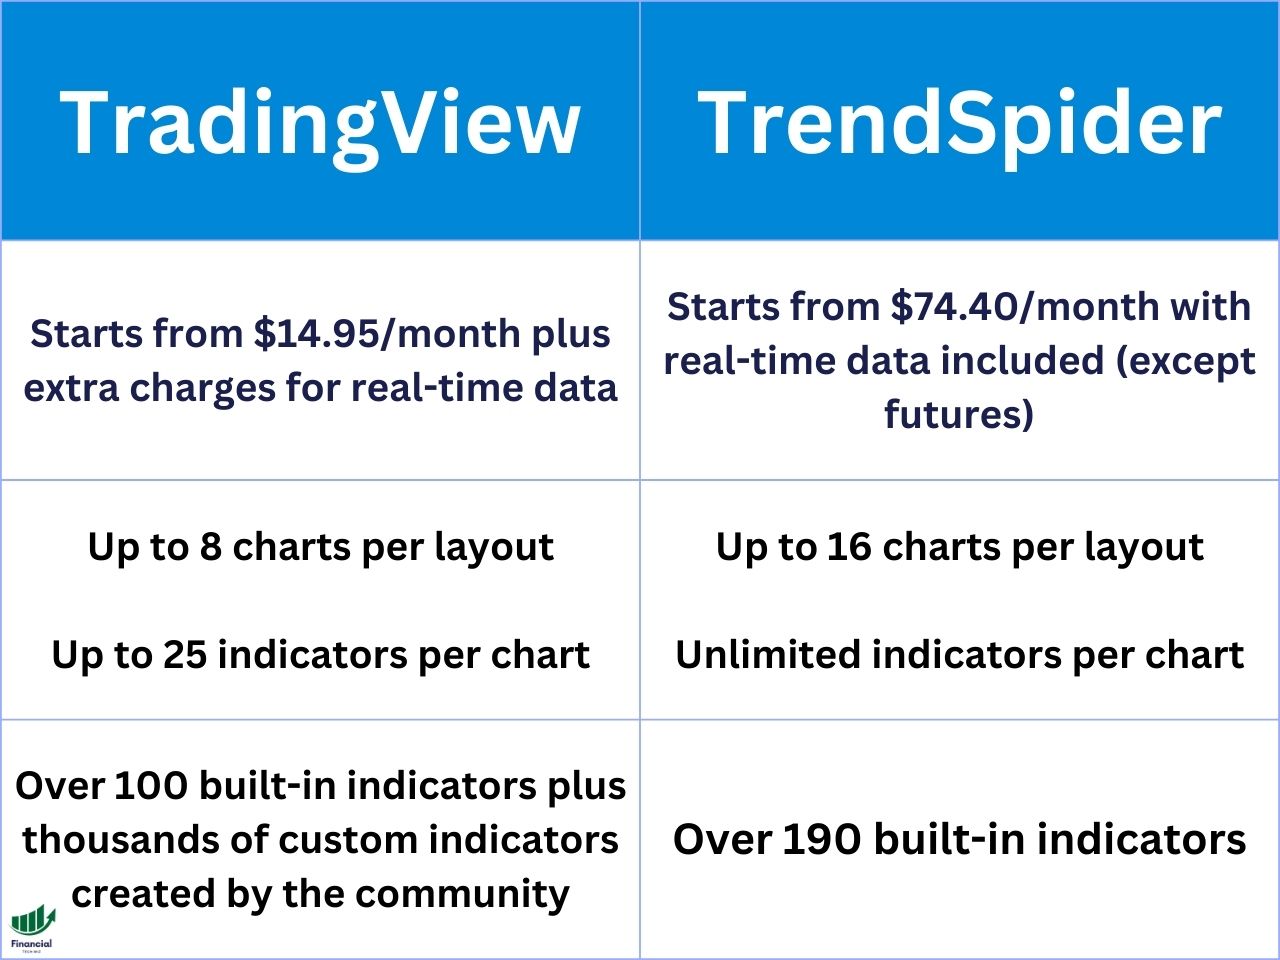
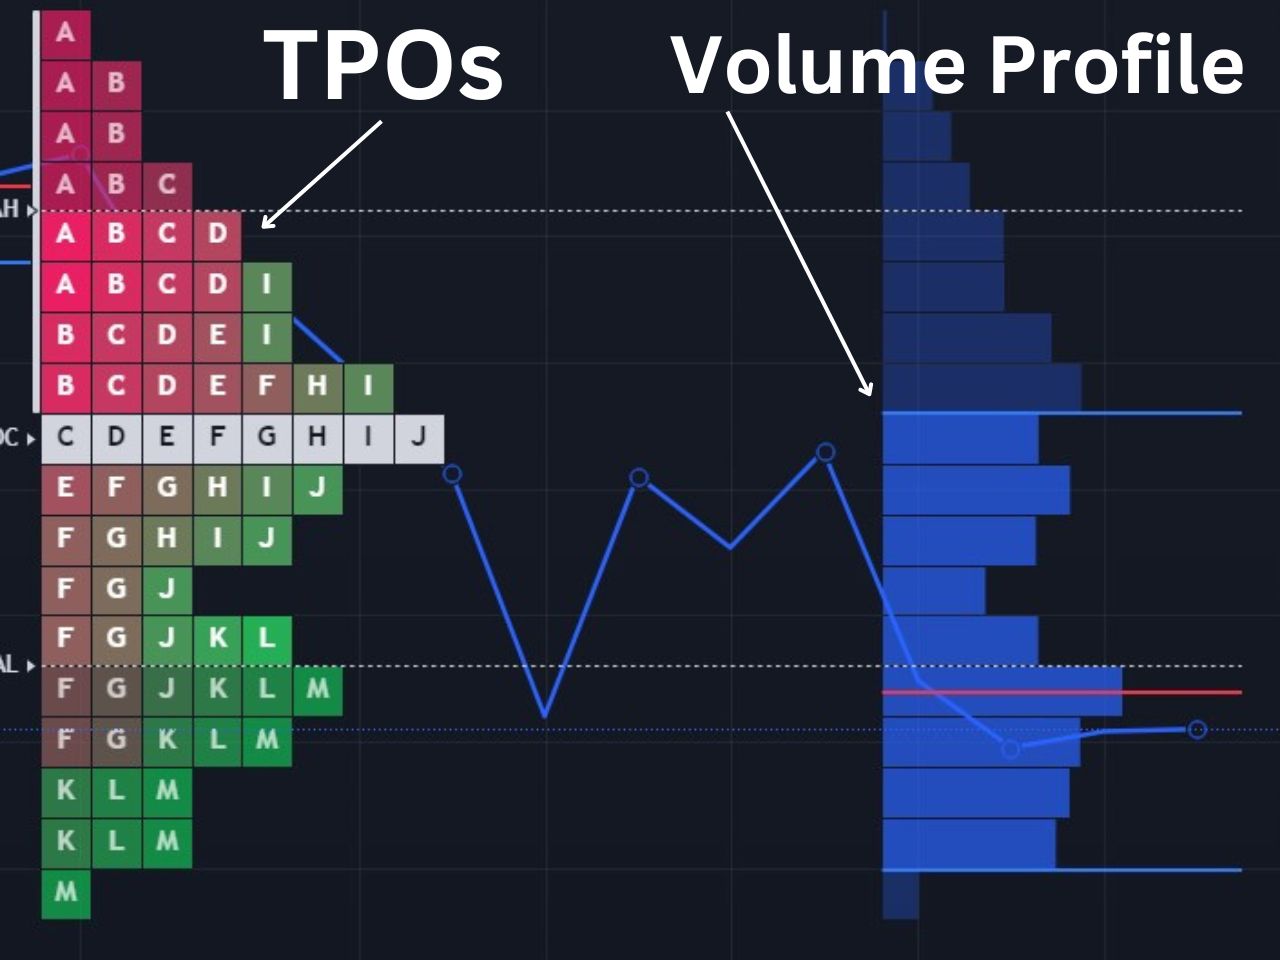
TradingView also offers premium plans with more features like the ability to get real-time data, advanced indicators like the volume profile, and access to multiple charts on a single layout.
TradingView Review – Key Takeaways
After my several years of trading and using nearly every trading platform, I rate TradingView as the best overall charting software available thanks to its freemium model, the ability to track all markets on a single platform, a large selection of indicators, and the seamless performance it provides. You can create an account and use it entirely for free, and you can always upgrade to a paid plan later on if you feel it is necessary.
TradingView Pros and Cons
Pros
✔ Track all markets, including stocks, ETFs, futures, crypto, and forex on a single platform
✔ Real-time data is provided at no cost whenever possible, while most competitors are delayed on free accounts
✔ The platform performance is extremely smooth and rarely experiences lag compared to competitors
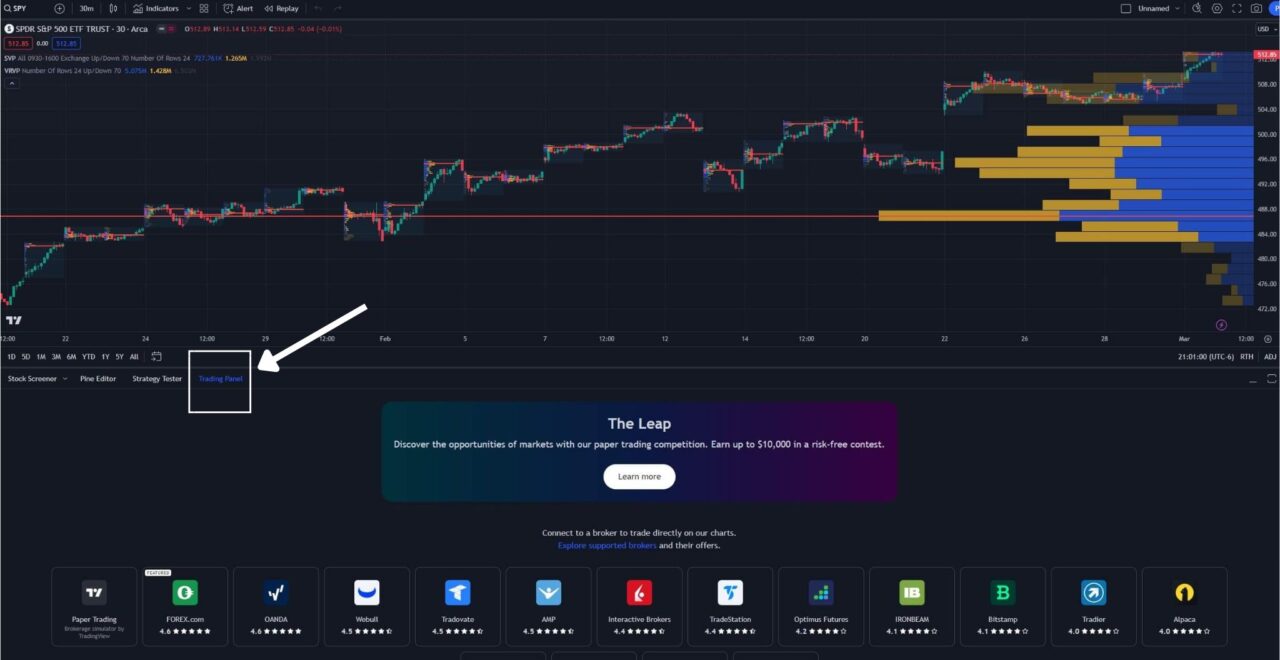
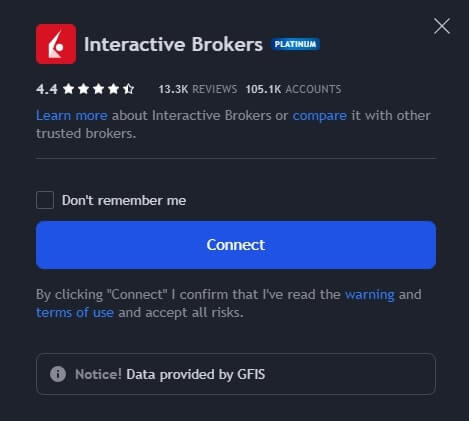
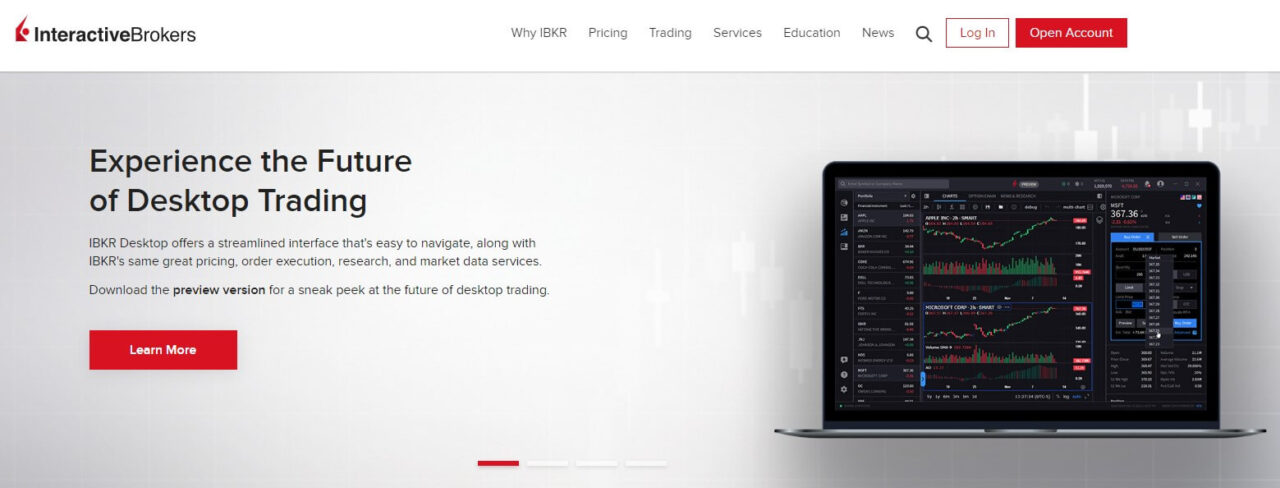
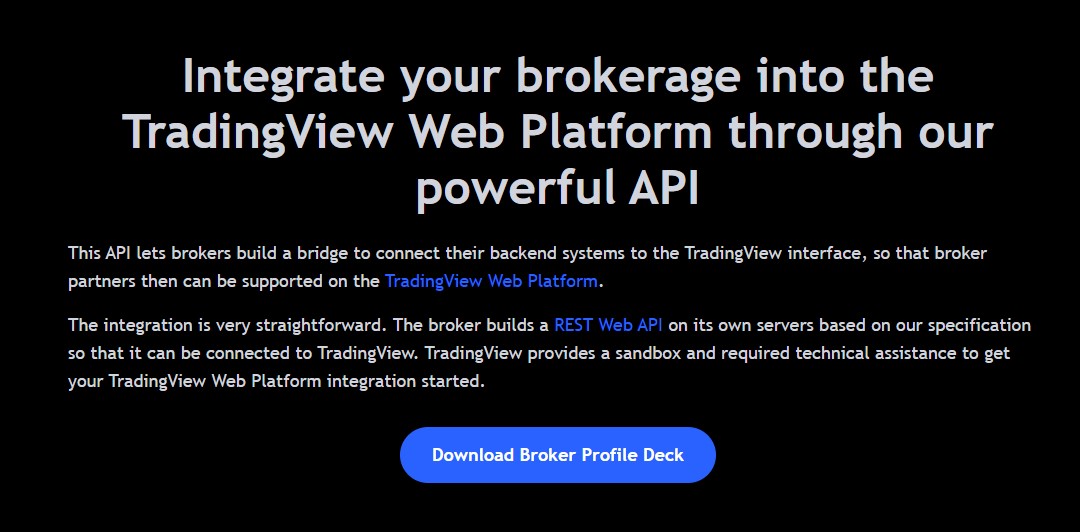
✔ You can connect with compatible brokers and utilize real-time data if you already pay for it
Cons
✘ If you want consistent real-time data, you must purchase it directly from the exchanges for an additional fee
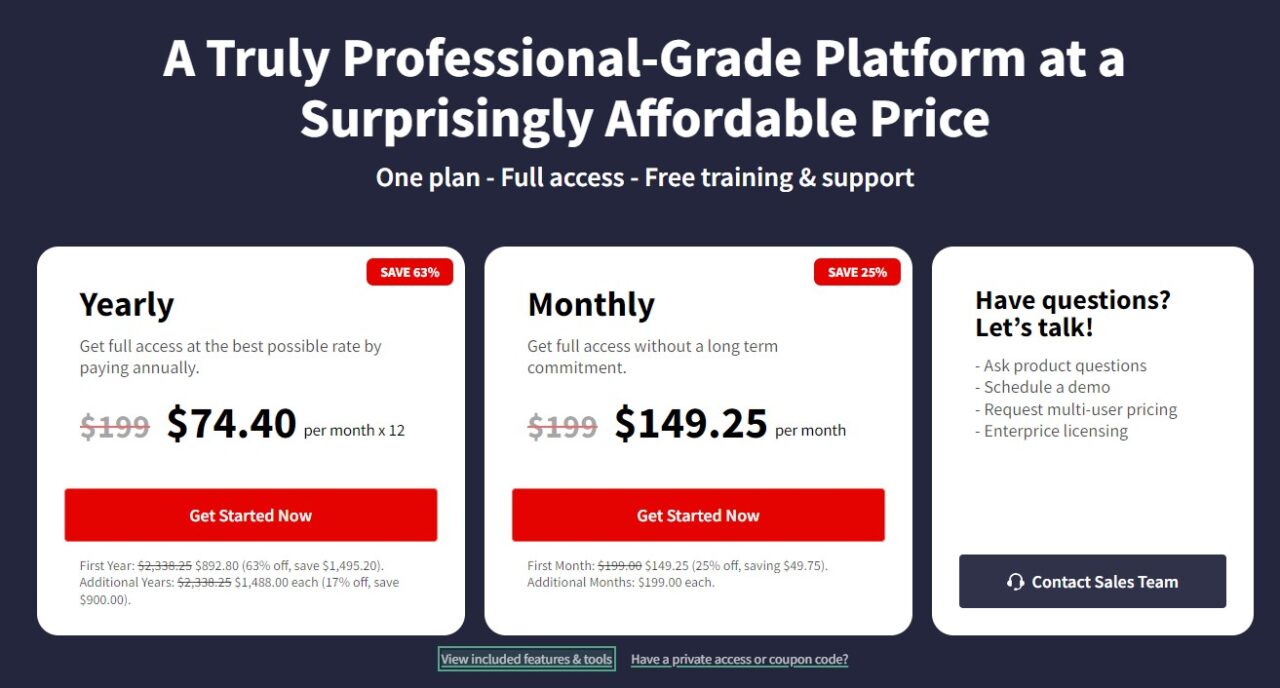
TradingView Pricing and Plans
TradingView is completely free to use but offers several paid subscription options, including:
- Essential: 2 charts per tab, 5 indicators per chart, 20 price alerts, and 20 technical alerts.
- Plus: 4 charts per tab, 10 indicators per chart, 100 price alerts, 100 technical alerts.
- Premium: 8 charts per tab, 25 indicators per chart, 400 price alerts, 400 technical alerts.
Here is a table comparing the pricing of the different plans:
| Free | Essential | Plus | Premium | |
|---|---|---|---|---|
| Cost (monthly) | $0 | $14.95 | $29.95 | $59.95 |
| Cost (annually) | $0 | $155.40 (save 13.38%) | $299.40 (save 16.69%) | $599.40 (save 16.69%) |
| Charts per tab | 1 | 2 | 4 | 8 |
| Indicators per chart | 2 | 5 | 10 | 25 |
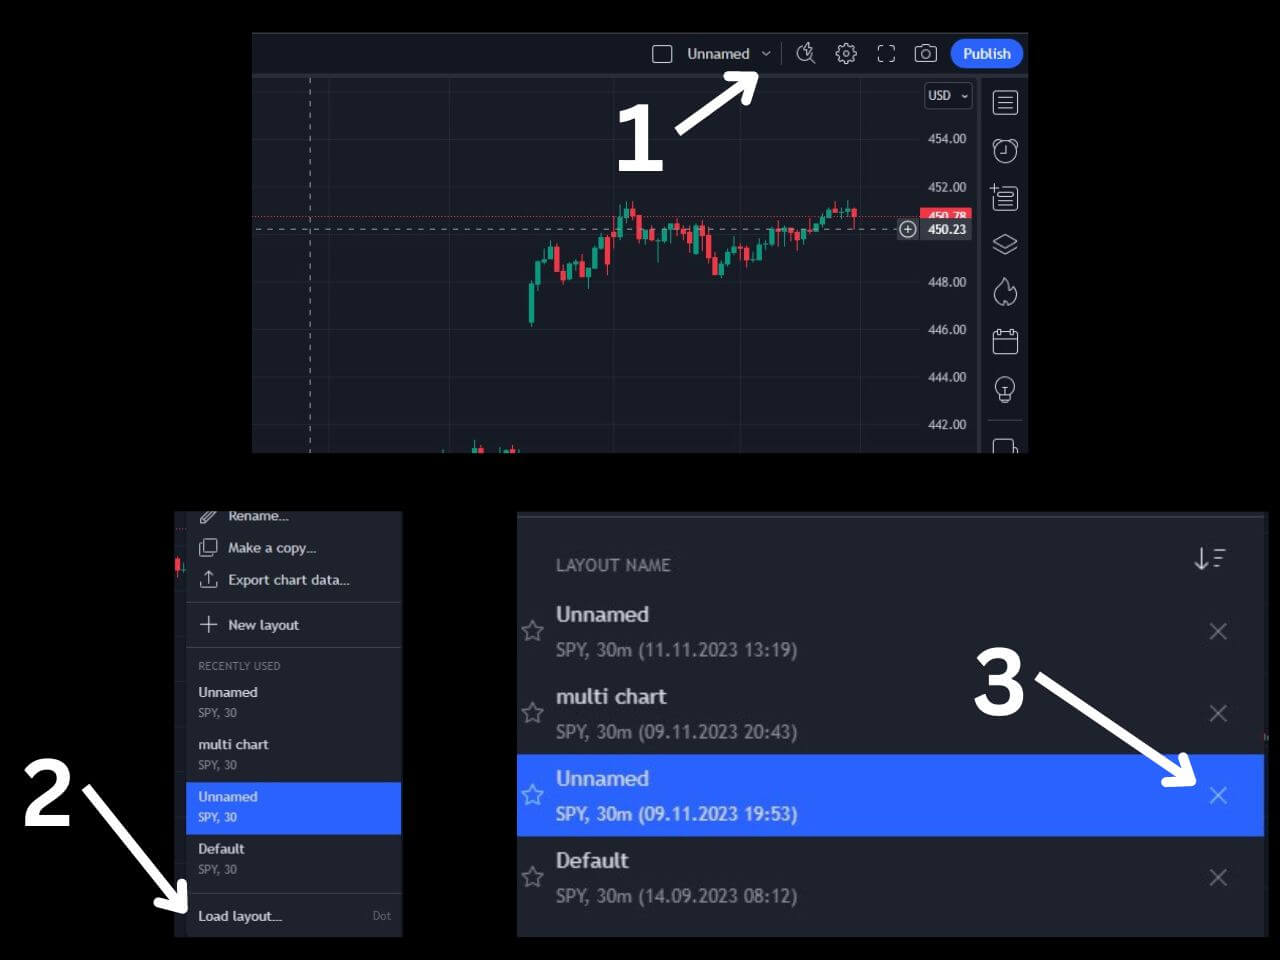
| Saved chart layouts | 1 | 5 | 10 | Unlimited |
| Watchlists | 1 | Unlimited | Unlimited | Unlimited |
| Price alerts | 5 | 20 | 100 | 400 |
| Technical alerts | 1 | 20 | 100 | 400 |
| Links | Free trial | Free trial | Free trial |
New users can usually test the paid plans by getting a TradingView free trial. You can view our TradingView plans comparison article for more information.
When you use my affiliate link to sign up for TradingView, you can get a referral credit and a 30-day free trial of the premium features!
Get a TradingView Referral Credit & Free Trial
Who is TradingView Best For?
TradingView is best for anybody who trades stocks, futures, crypto, or forex and wants a single platform to chart all of these assets. Many other charting platforms charge for real-time data, but TradingView offers it for free wherever it can. This means even if you don’t pay for a TradingView plan, you can still use it for charting with nearly real-time data.
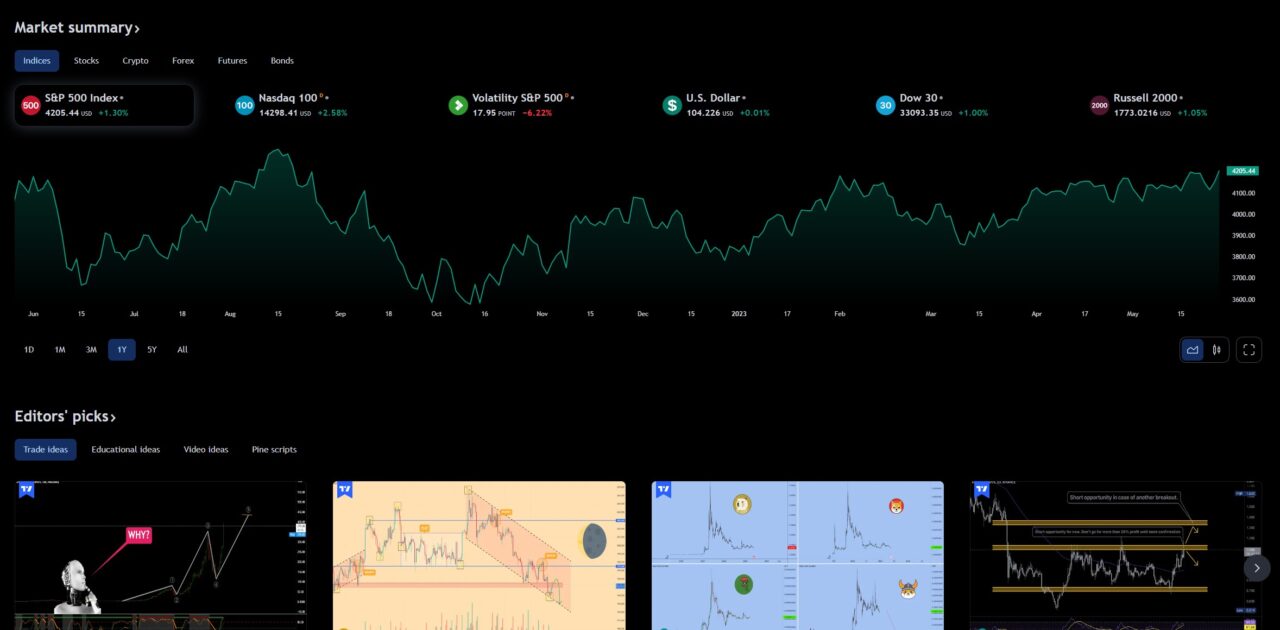
Utilizing TradingView’s Features
The main features of TradingView include charting, screeners, backtesting, economic calendars, alerts, watchlists, and more! All of these features are easy to access from the home screen, so let’s cover them in depth.
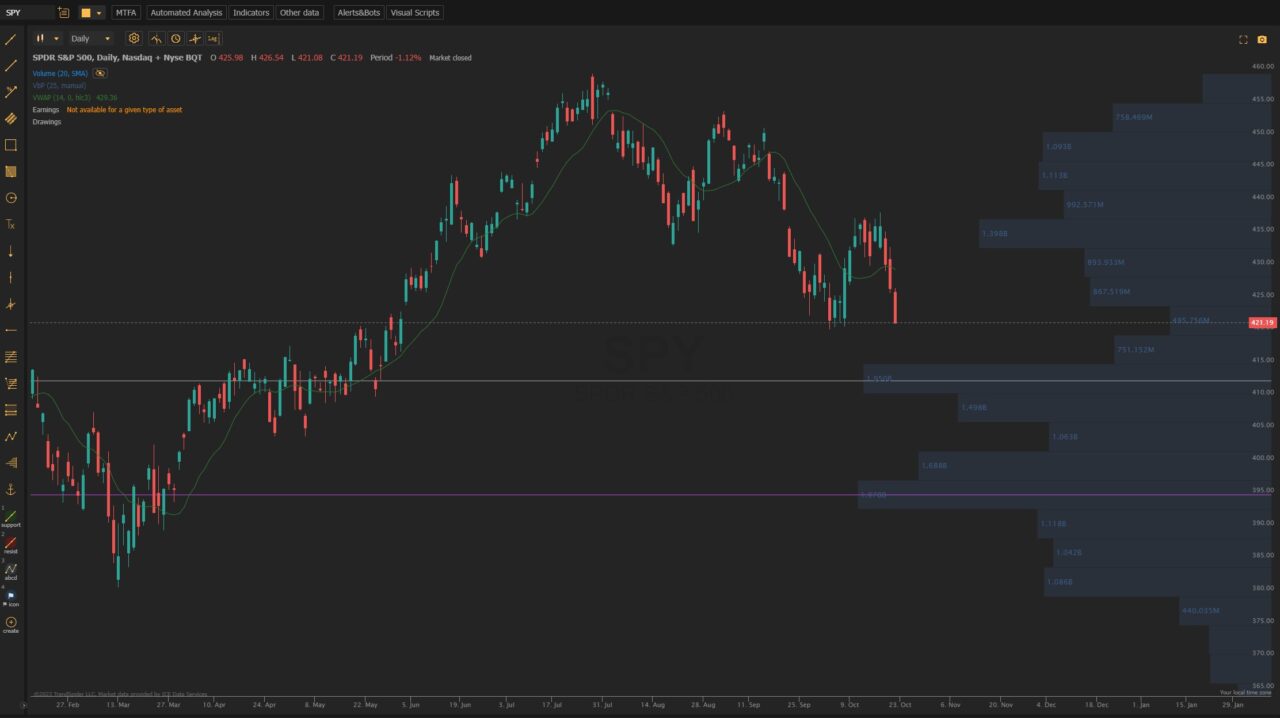
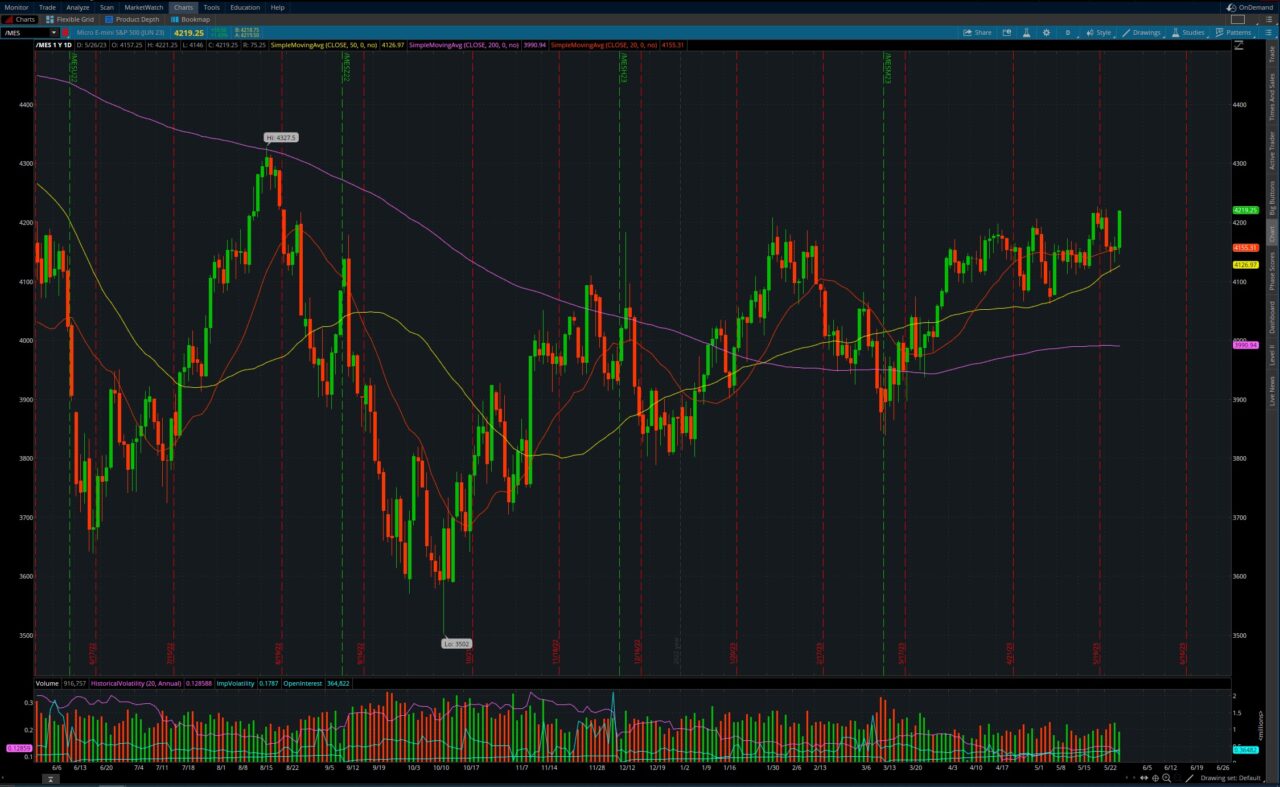
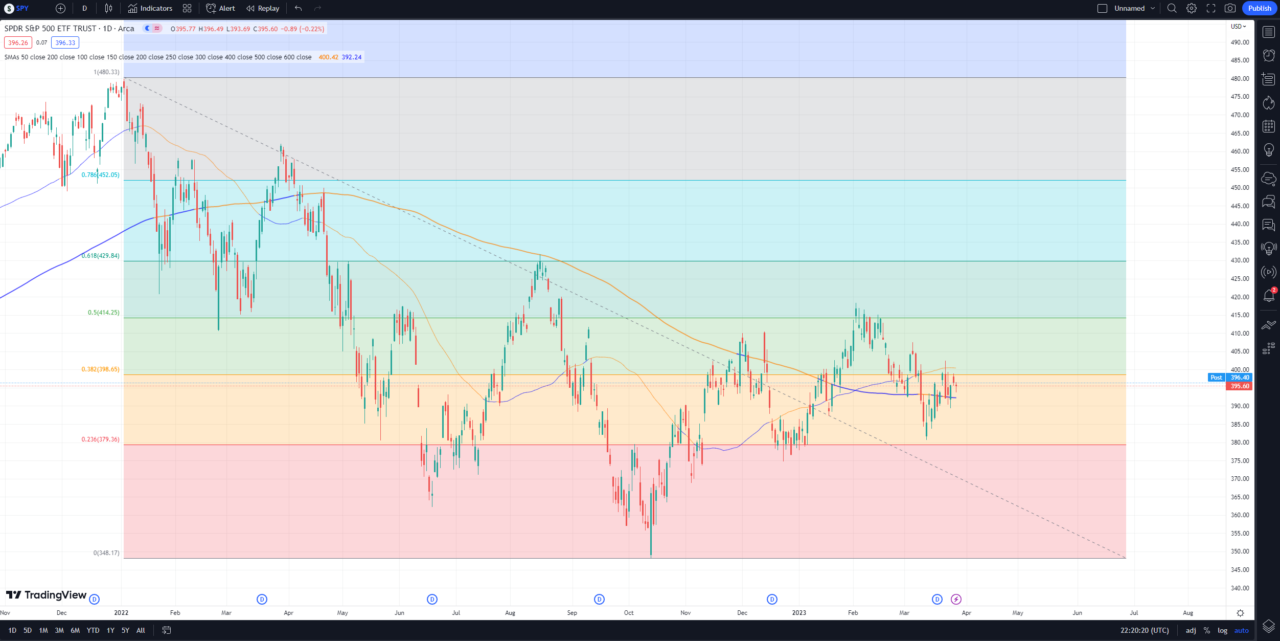
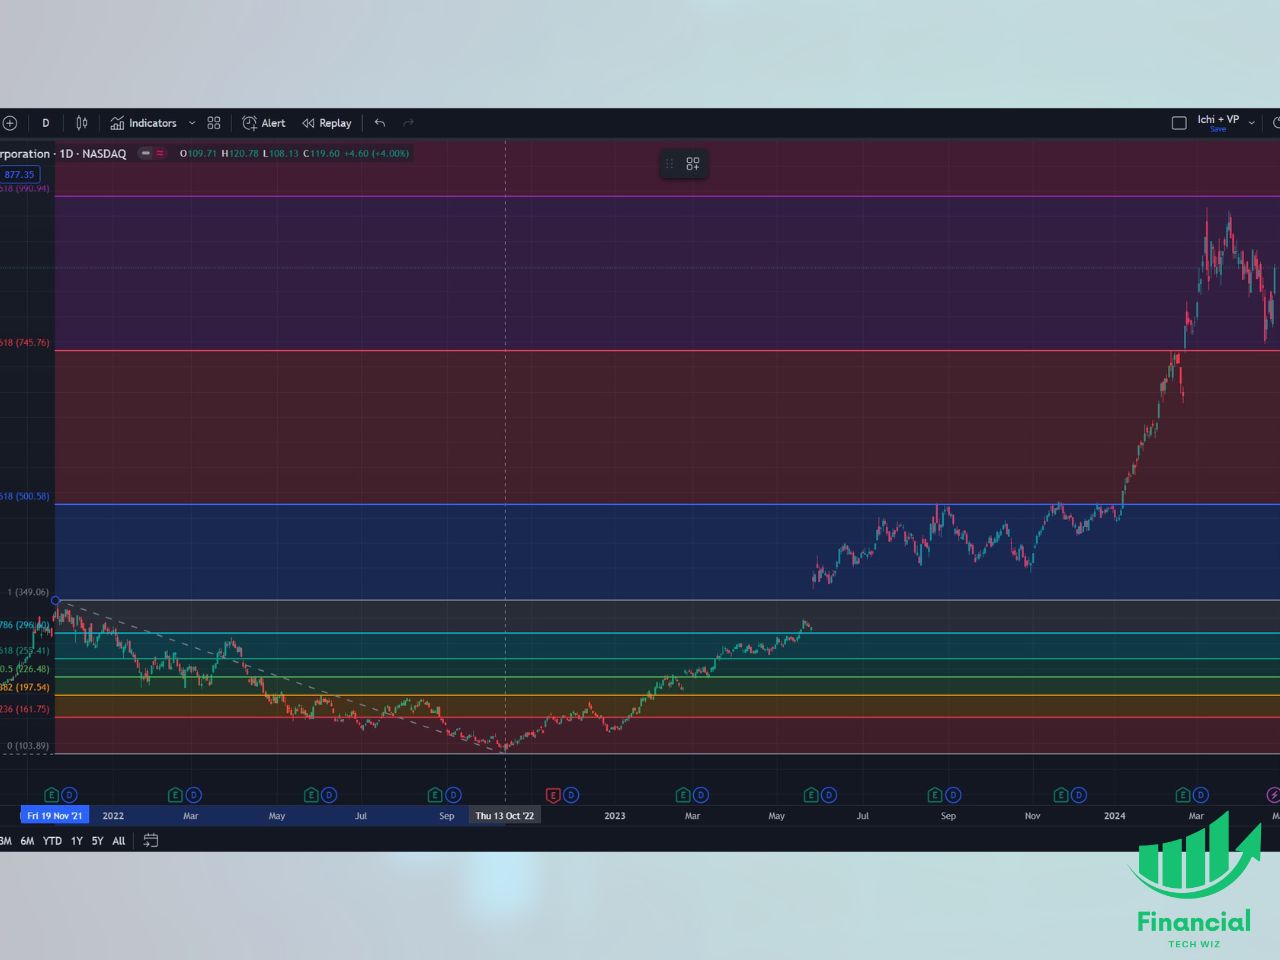
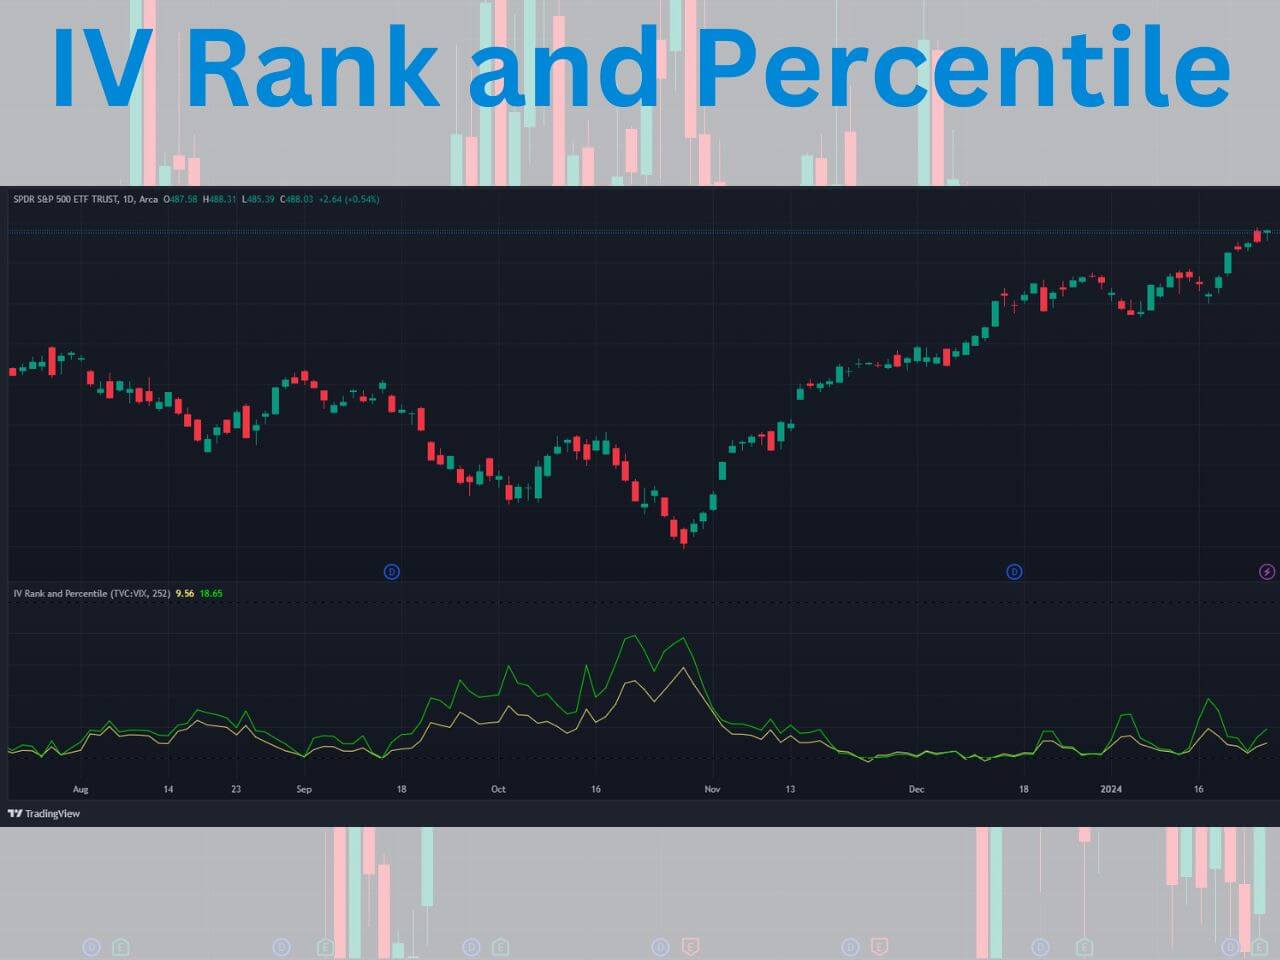
TradingView Technical Analysis Charting Review
One of the best features of TradingView is the ability to chart all markets within a single platform, including assets like stocks, ETFs, futures, forex, cryptocurrencies, and more.
Many brokerages offer charting, but generally, they are made for just one asset class. Additionally, brokerage charting platforms are usually an afterthought, while TradingView is designed for active traders seeking advanced charting tools. Therefore, many traders will place trades on a brokerage platform while using TradingView for charting.
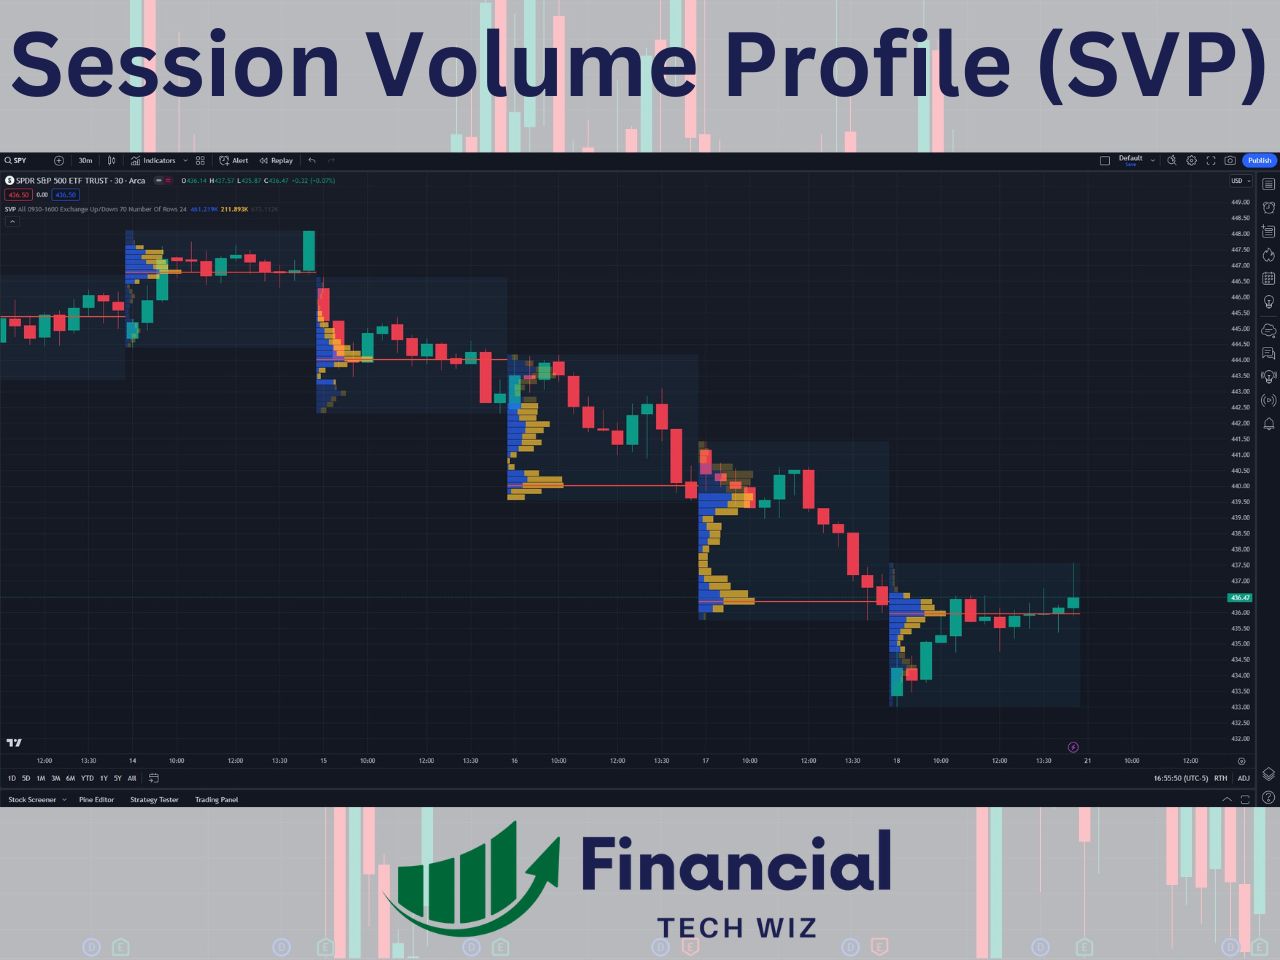
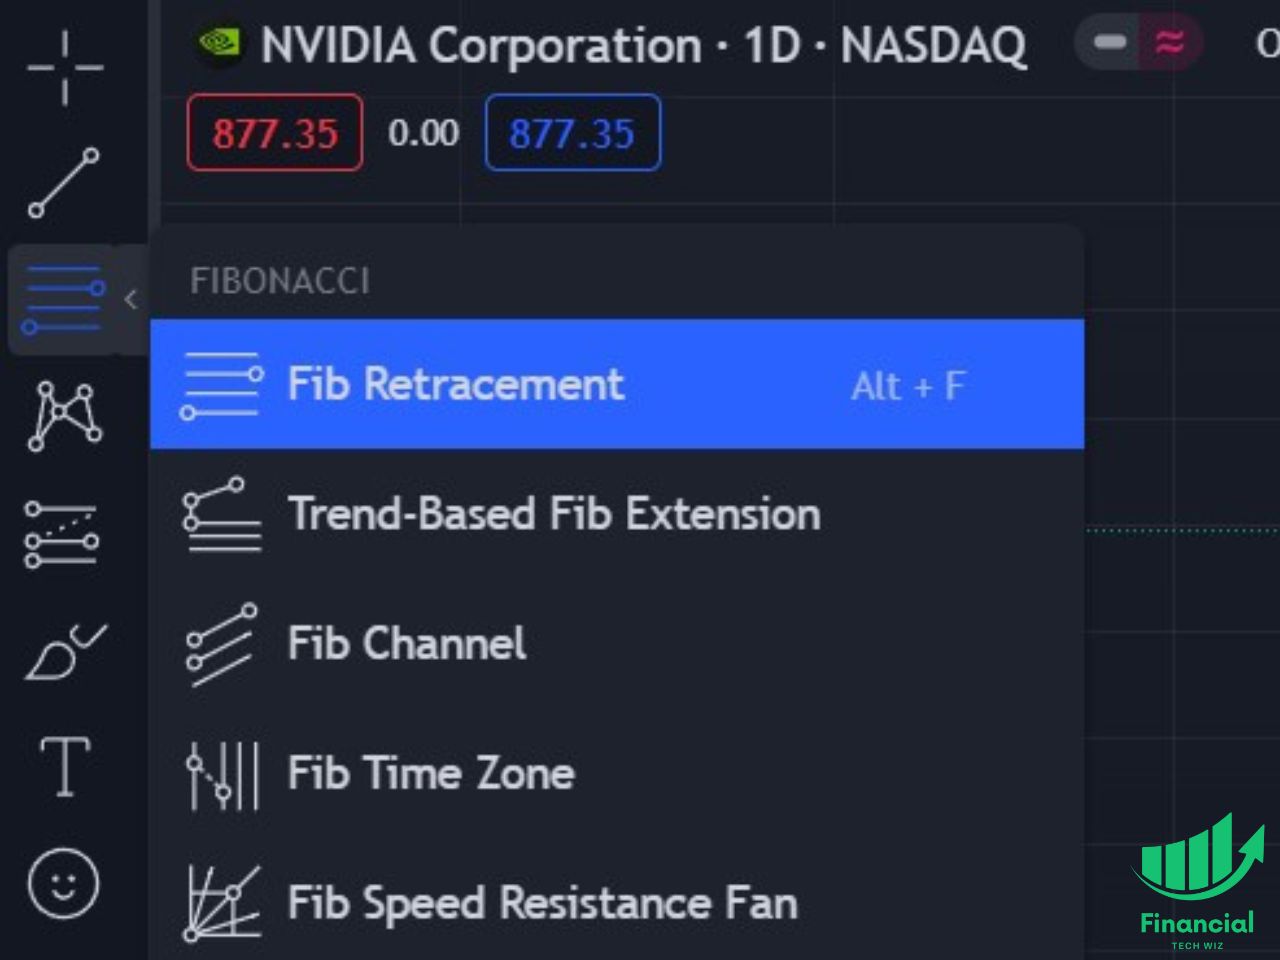
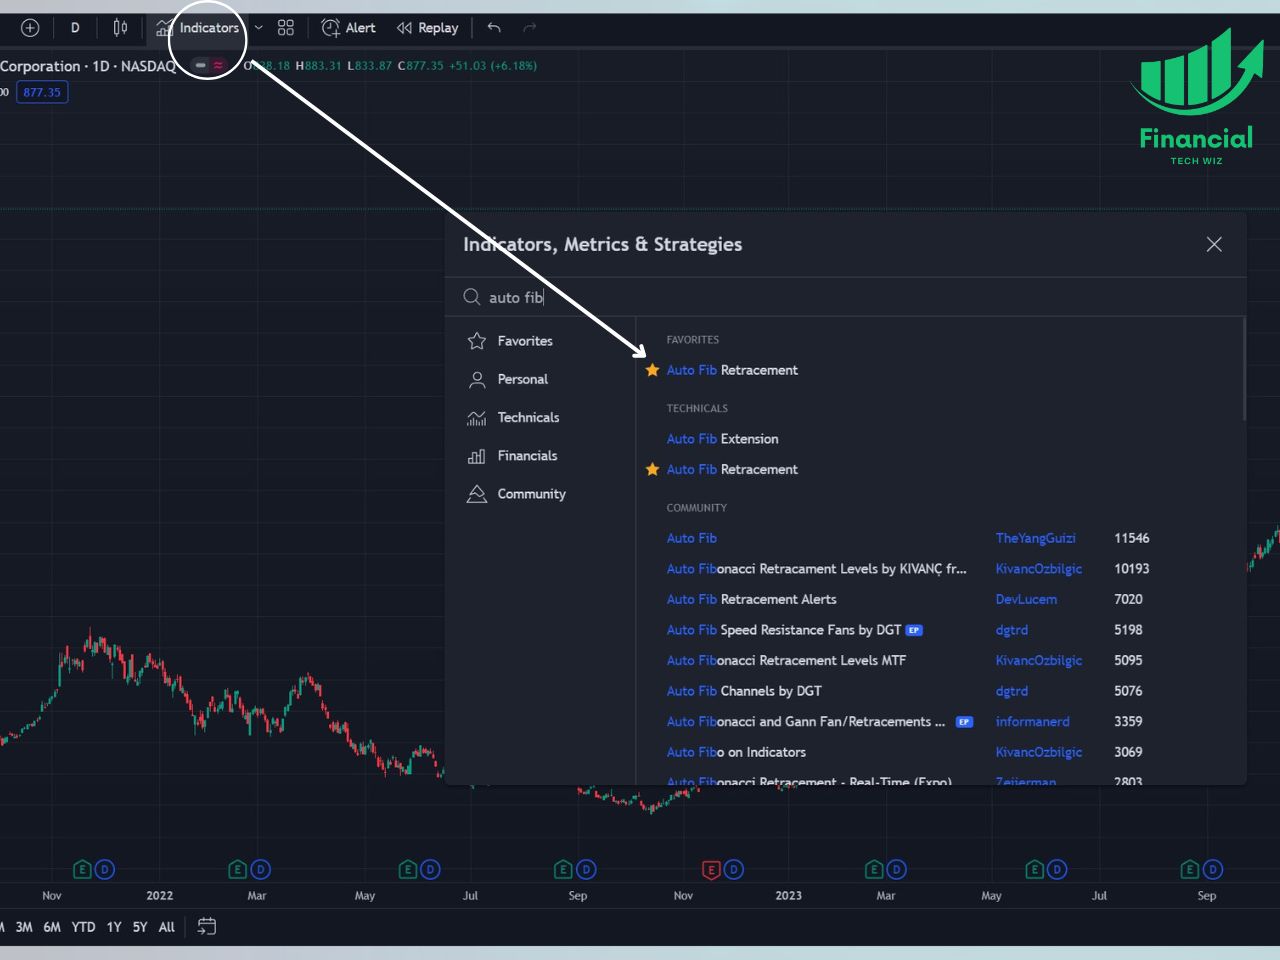
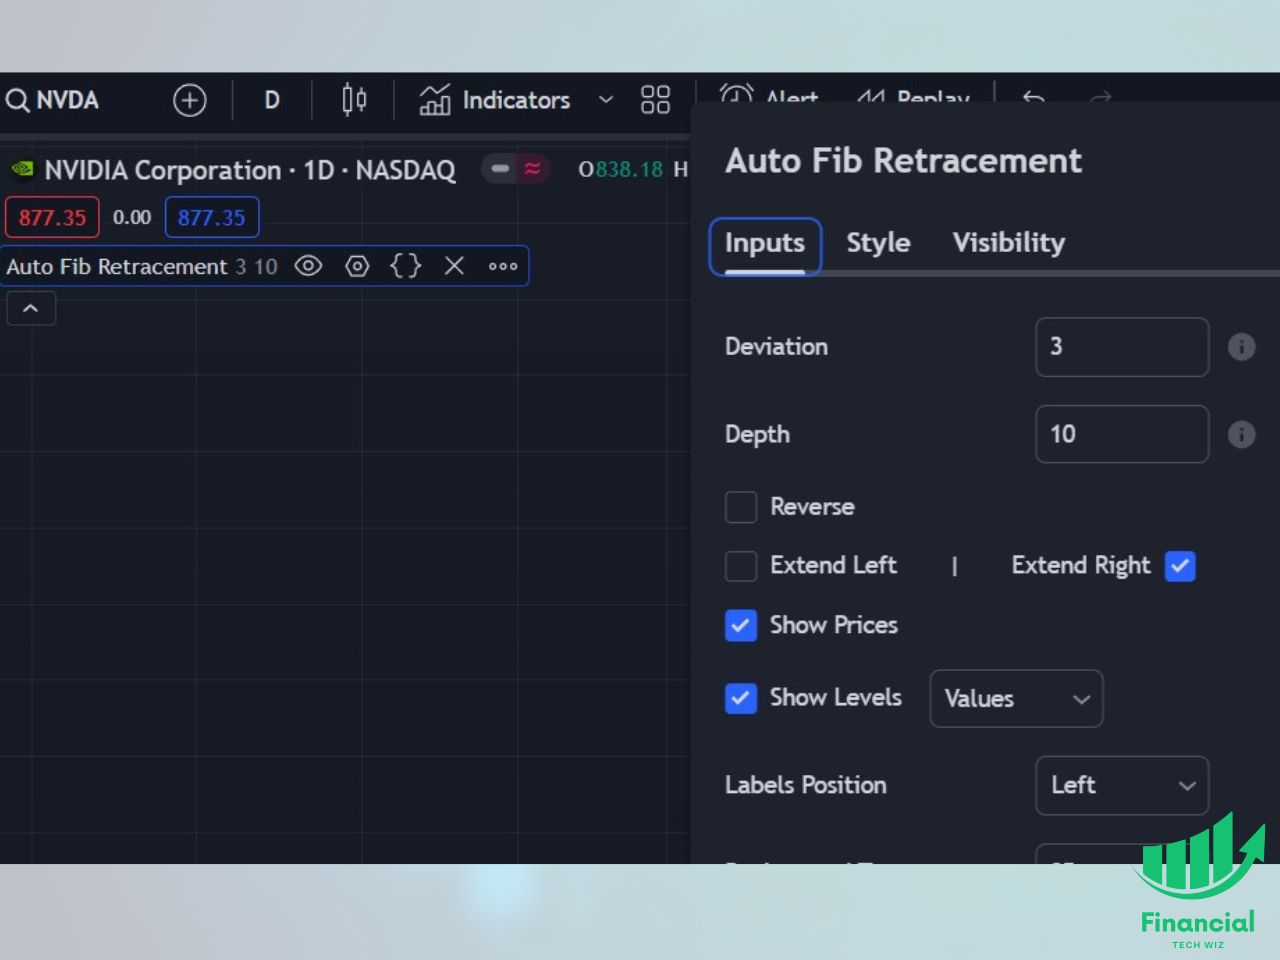
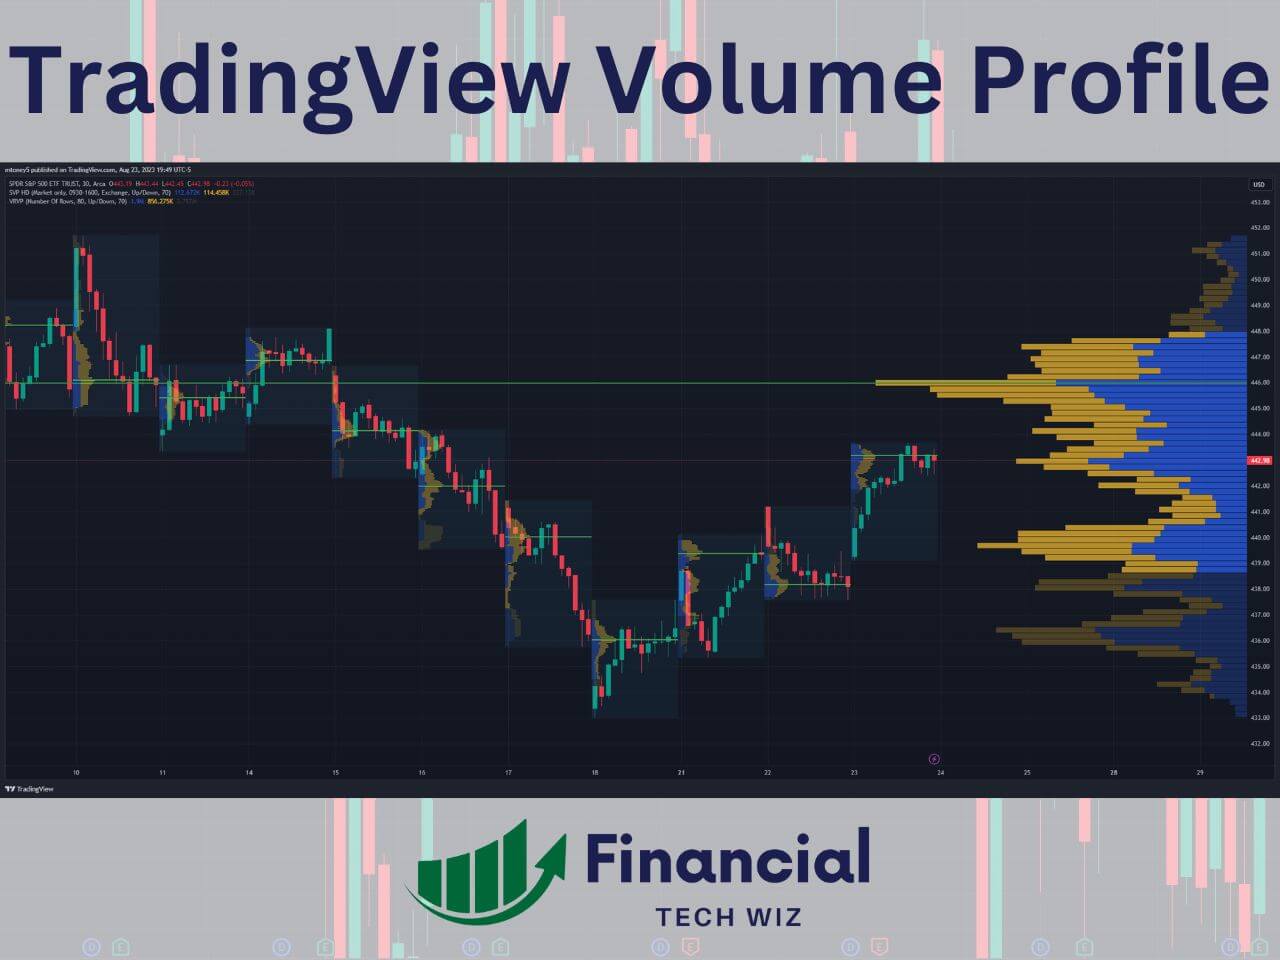
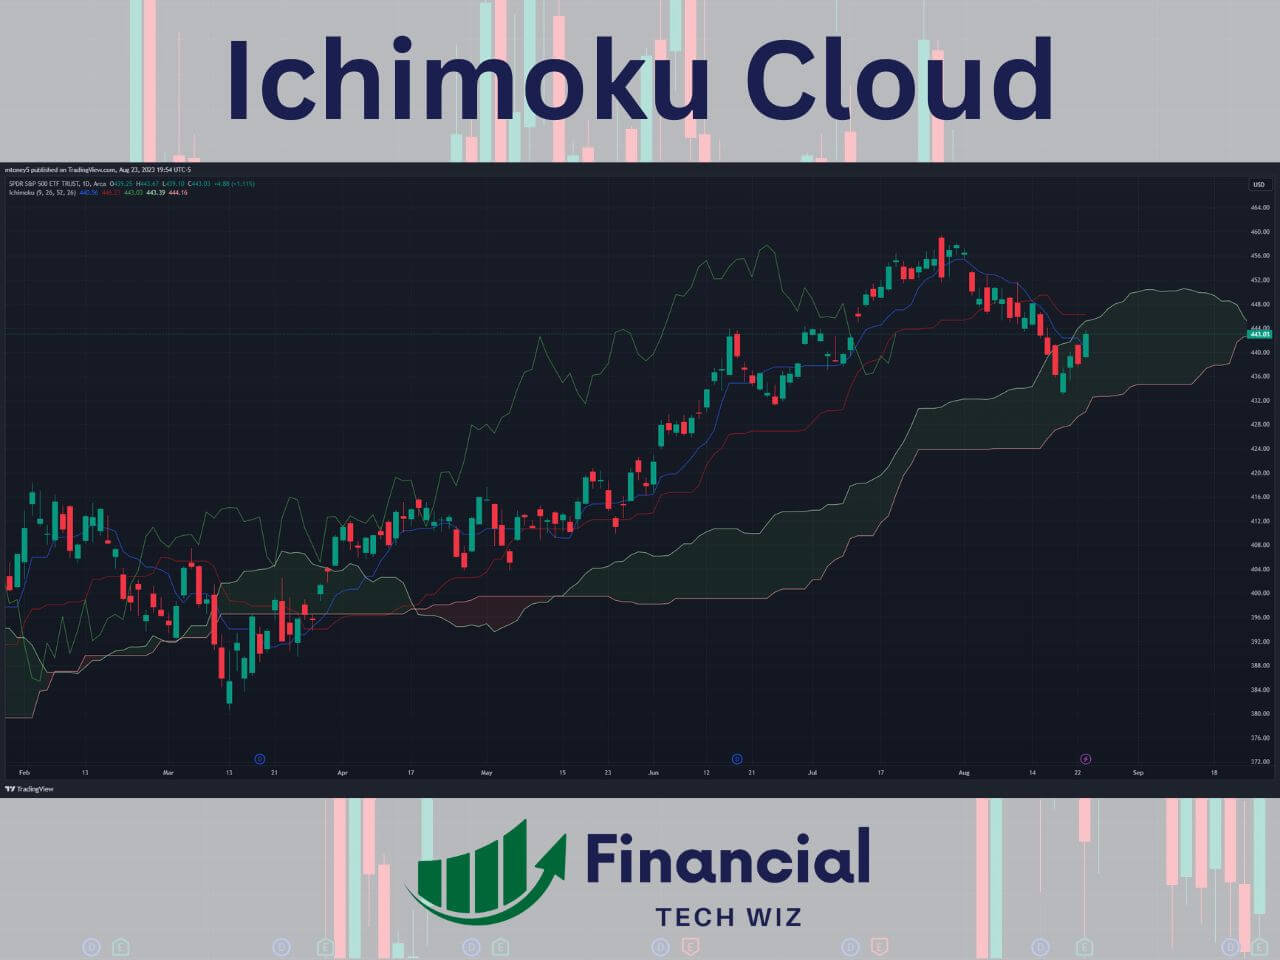
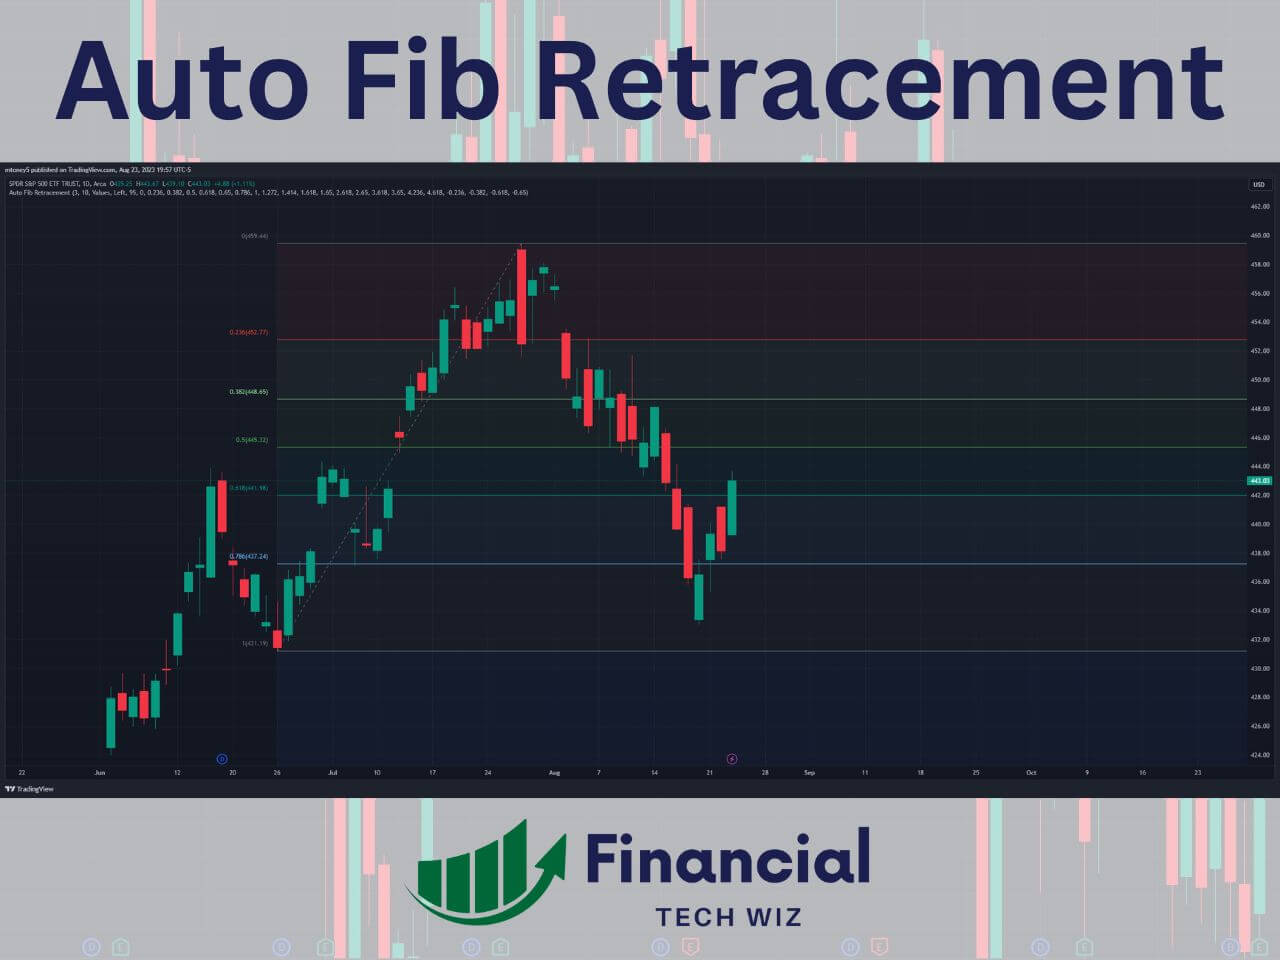
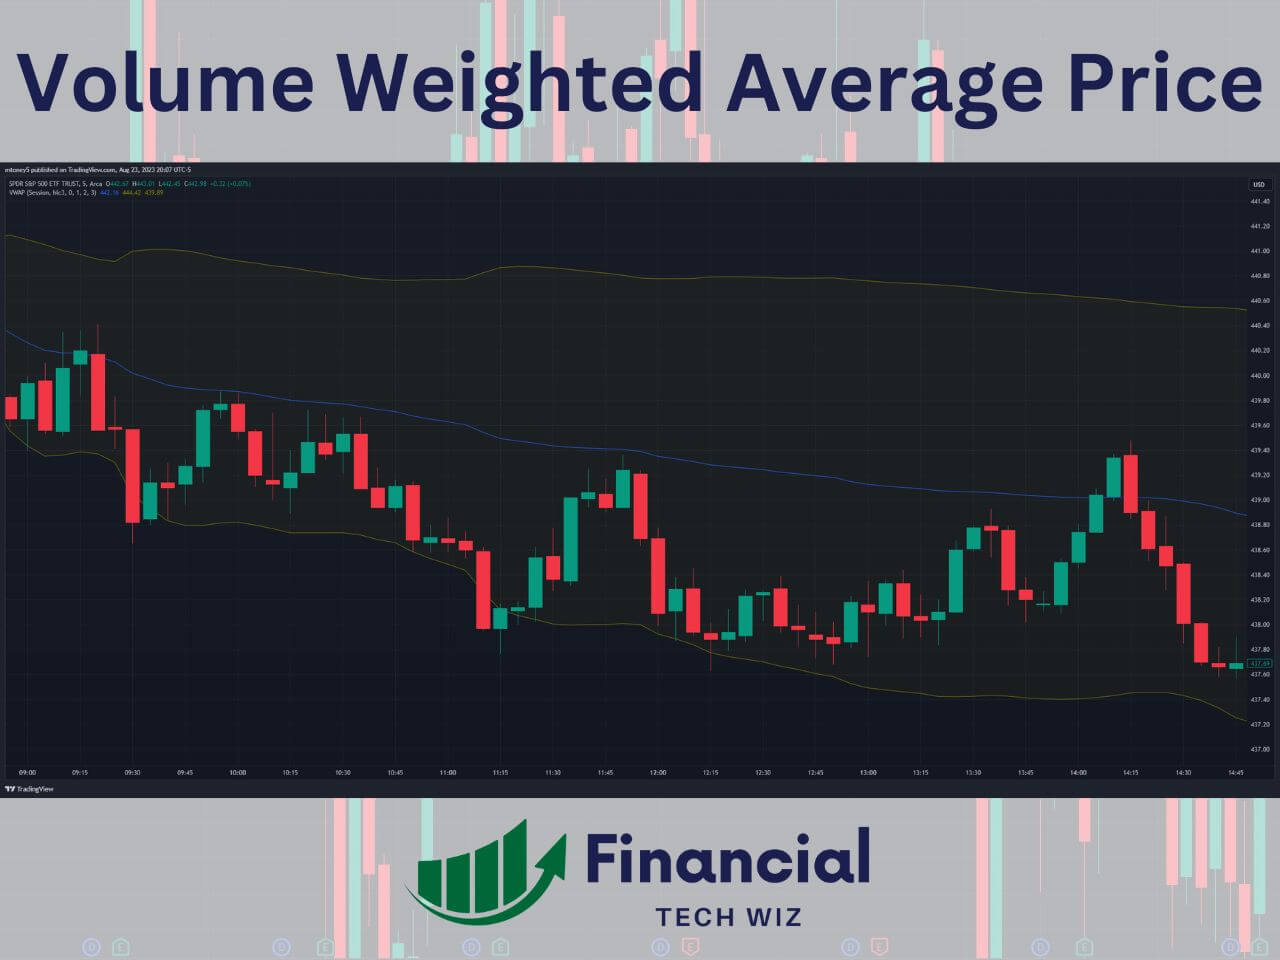
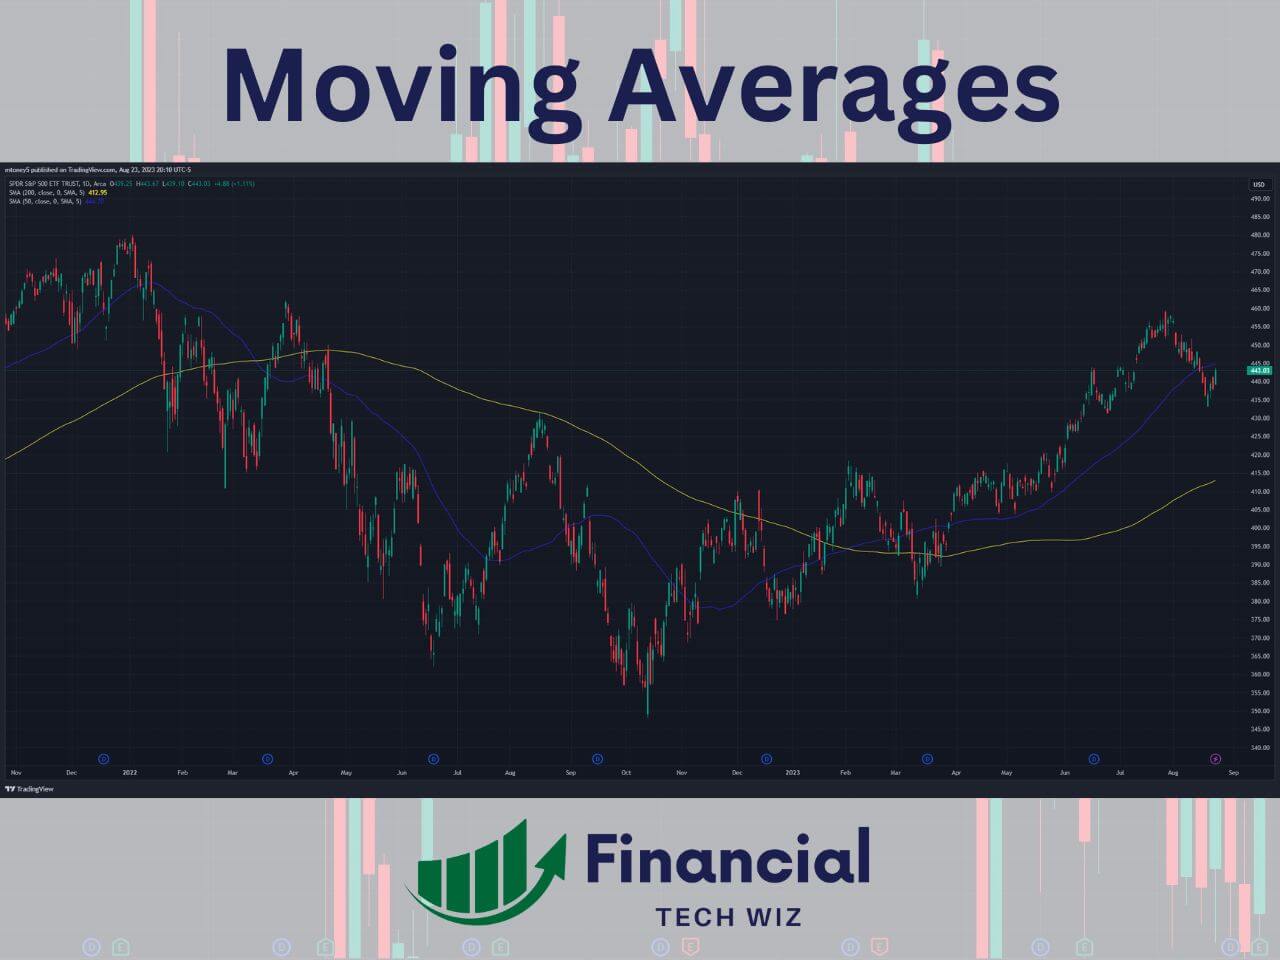
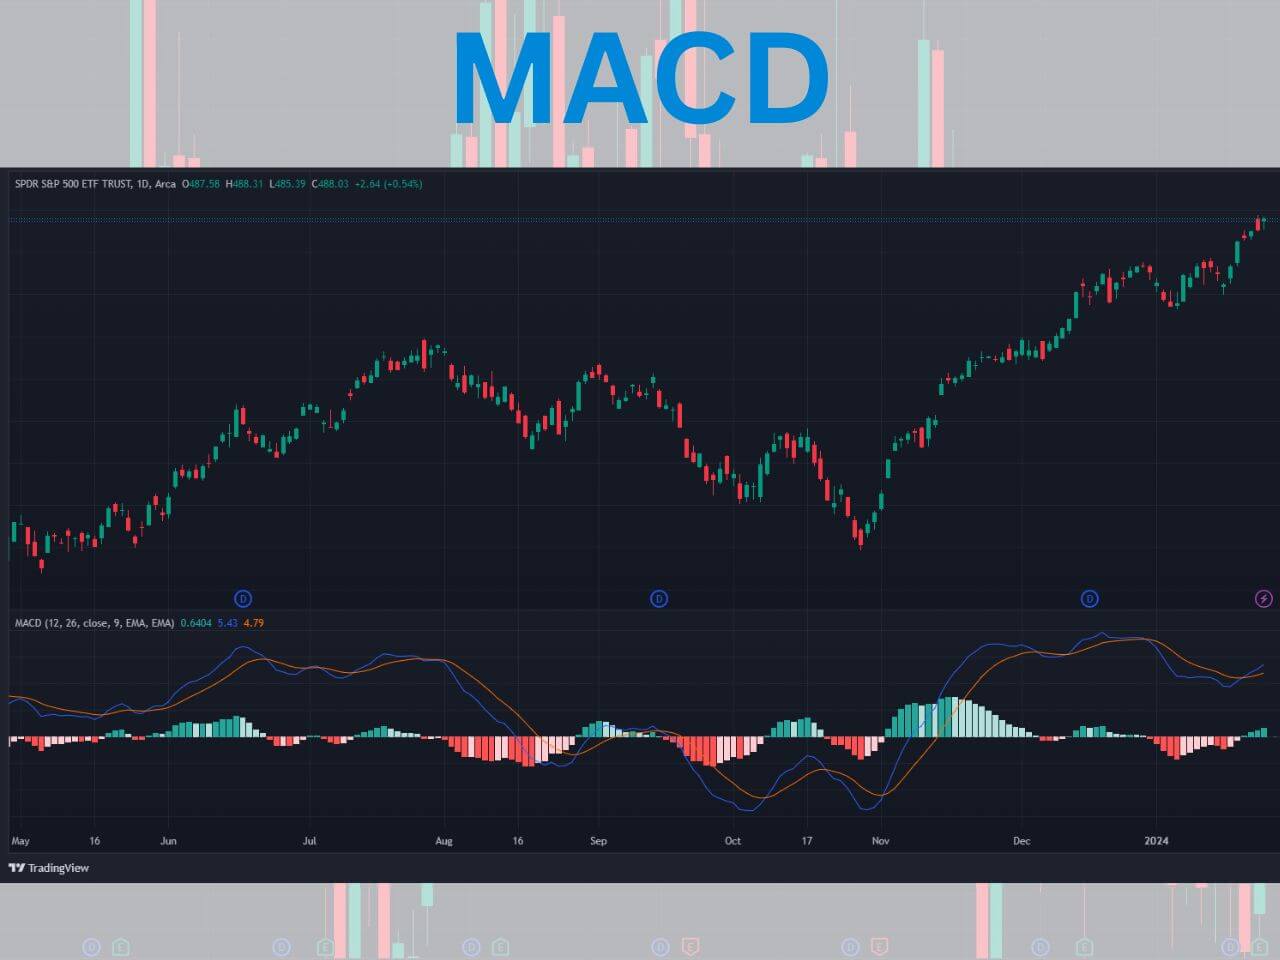
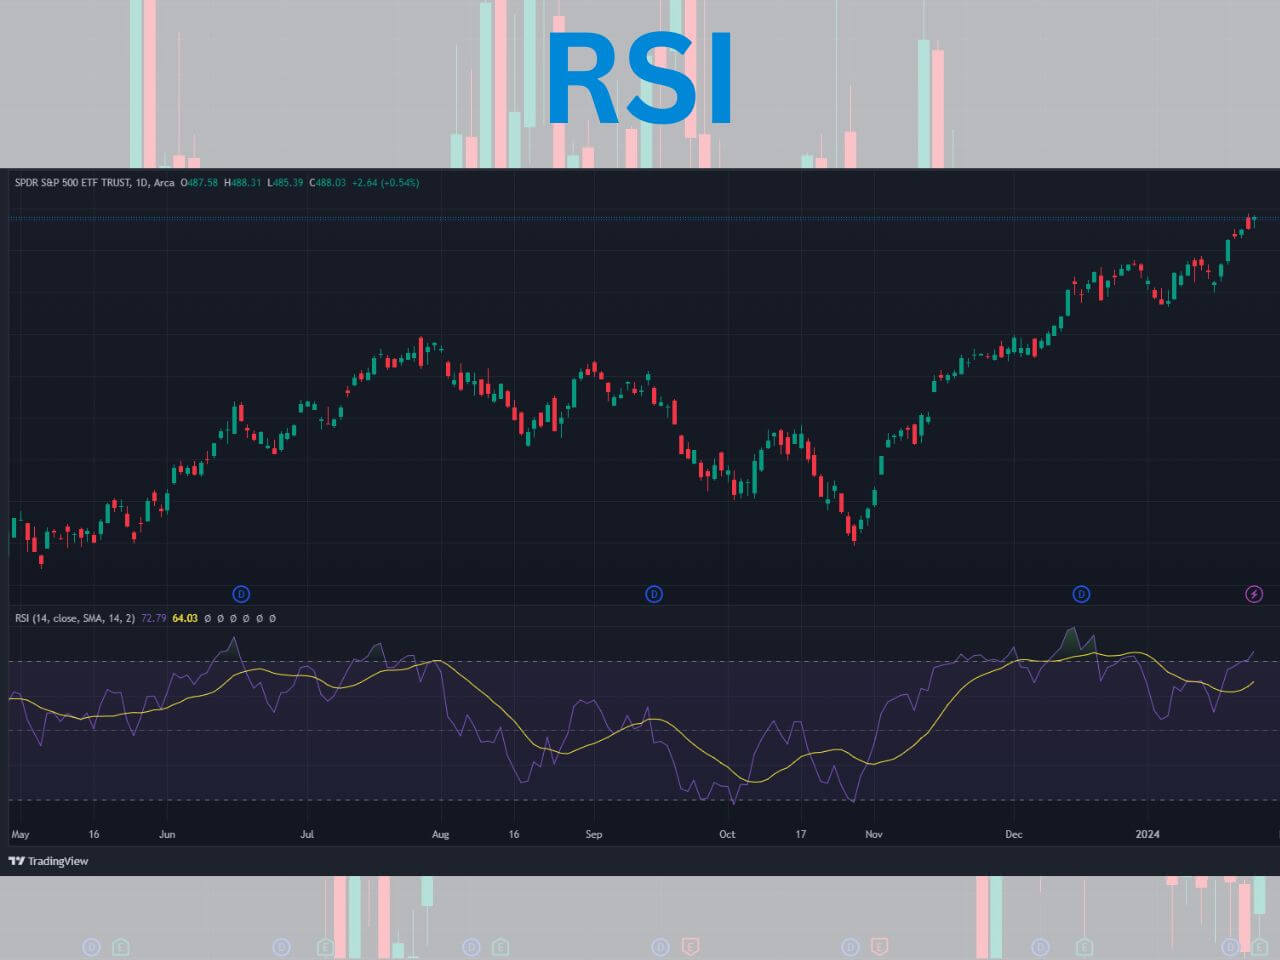
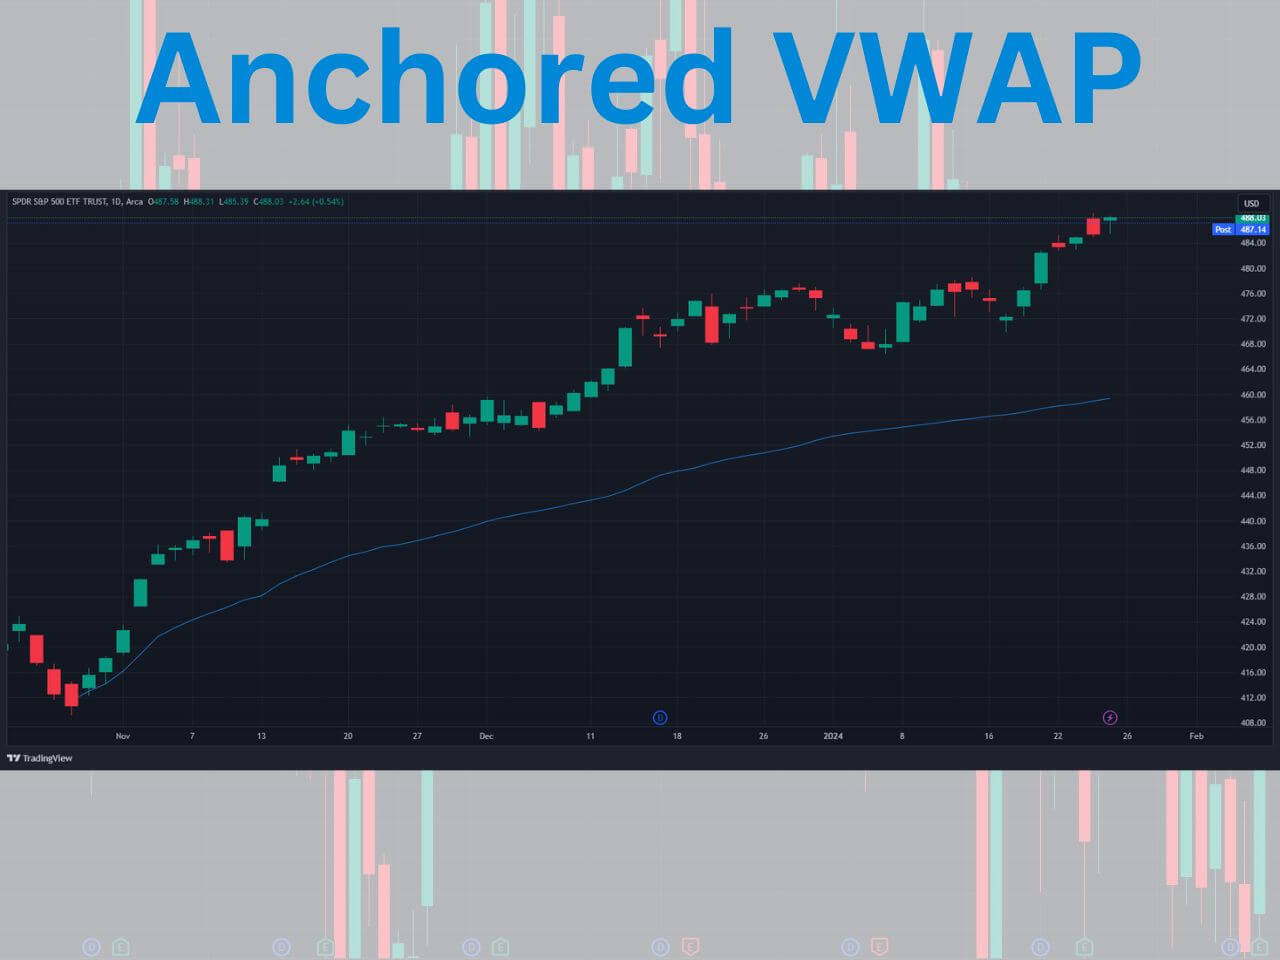
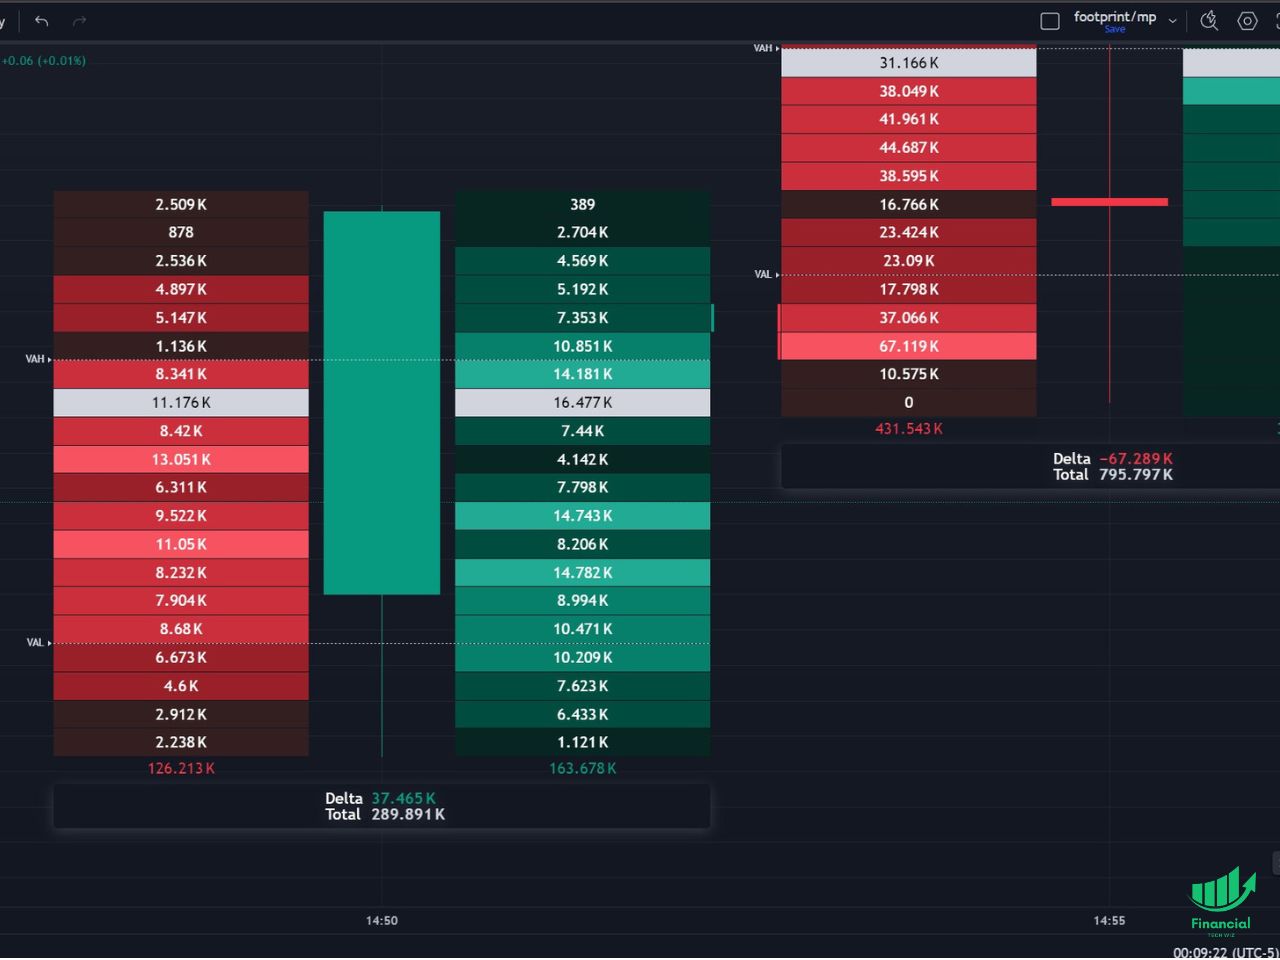
TradingView also allows you to code custom indicators and strategies with its proprietary Pine Script language. There are tons of TradingView indicators you can use for free by default, plus there are paid indicators like the volume profile you can use with a premium subscription.
Using the TradingView Screeners
Another excellent feature TradingView offers is screeners for stocks, crypto, and forex. The TradingView Screener 2.0 is the most advanced one and is free to use; you just need to sign up for a free TradingView account.
You can customize these screeners based on your preferences, allowing you to discover trading opportunities with ease.
For example, if you are an investor, you can scan for stocks based on fundamental data like P/E ratios and EPS. Active traders can also search for high-volatility stocks based on % change and volume. The ideas are endless with TradingView’s screeners, suiting both active and long-term traders.
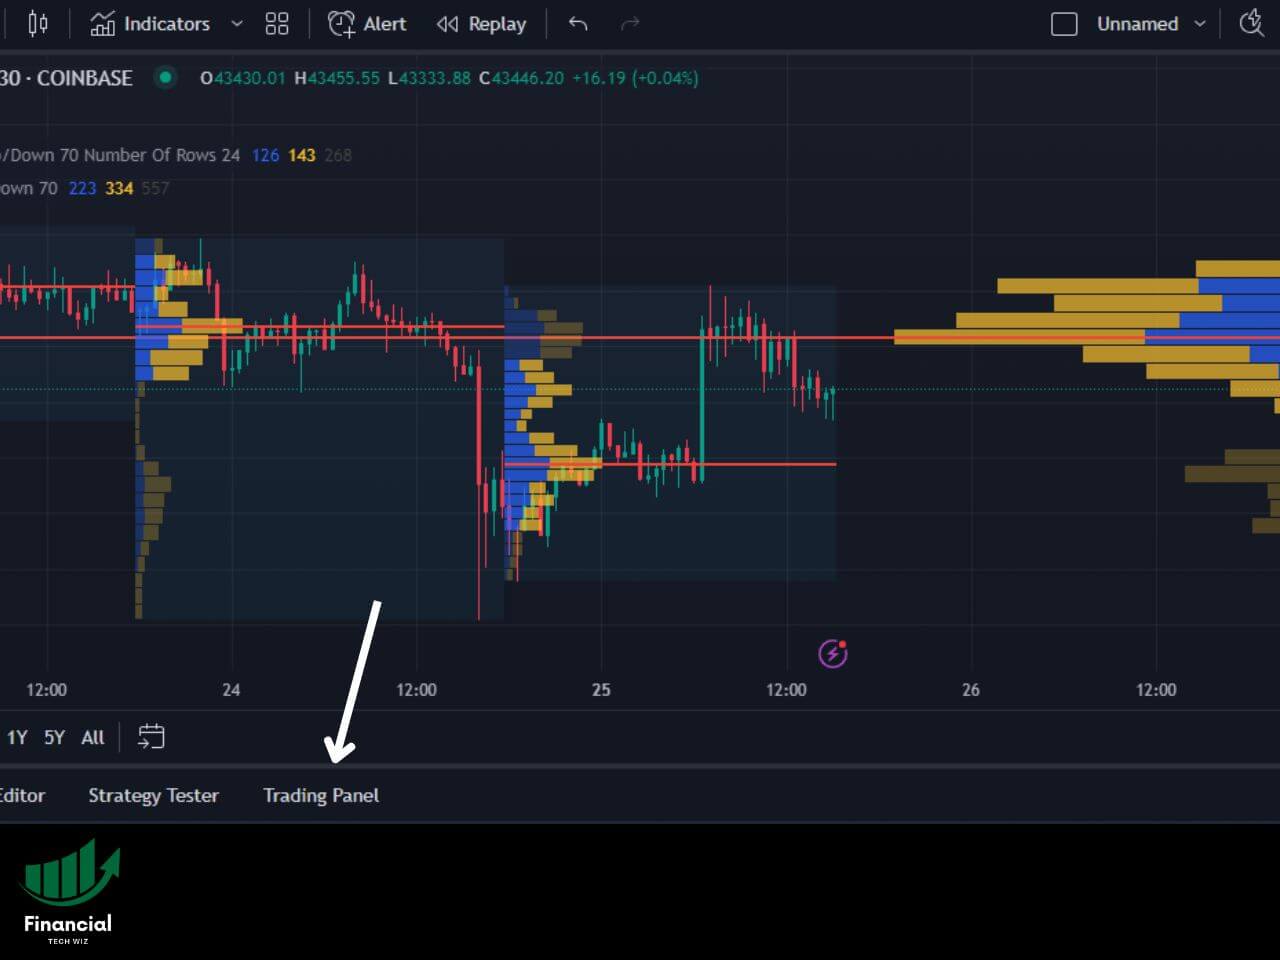
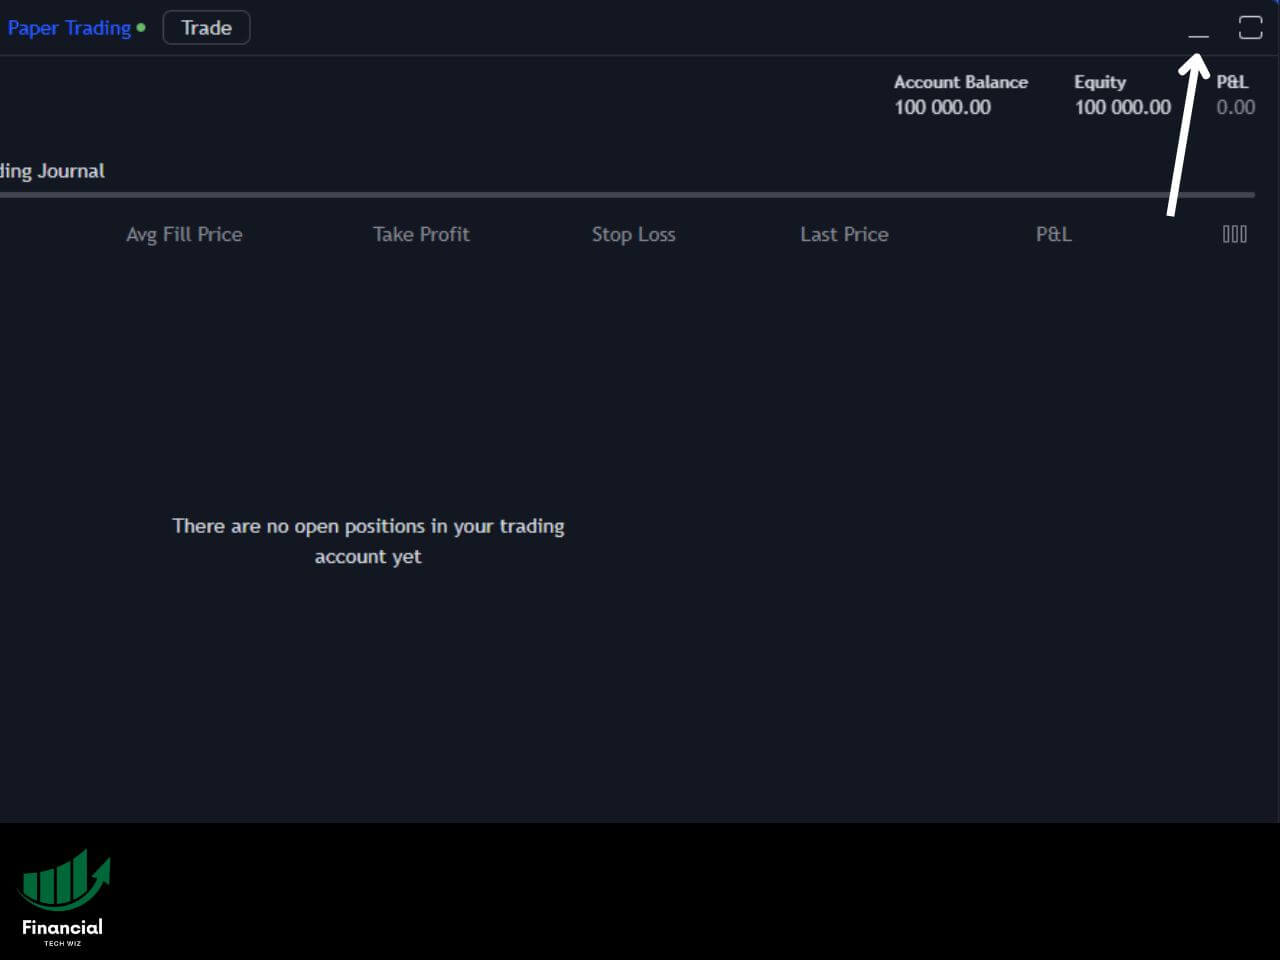
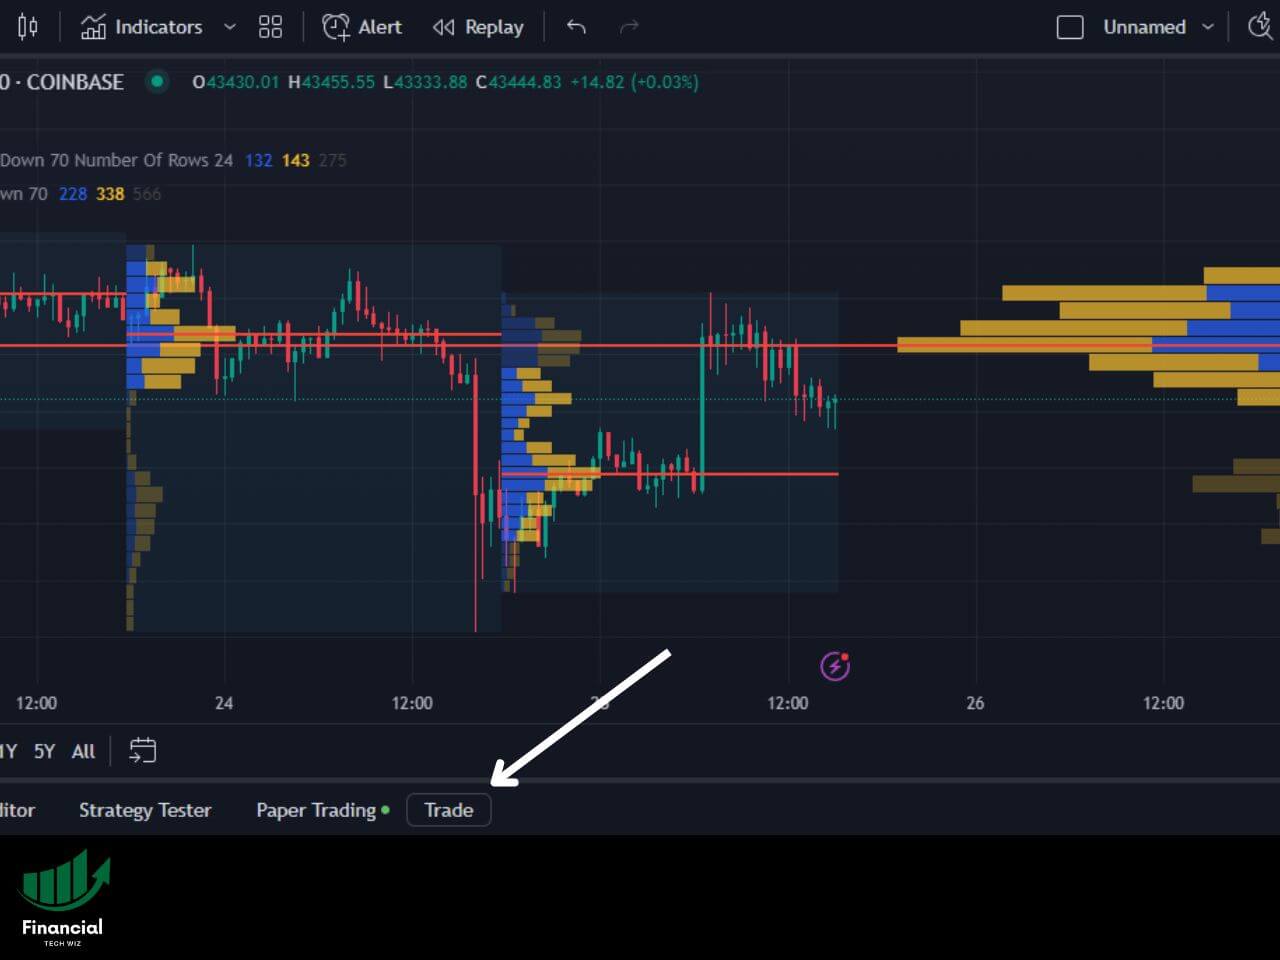
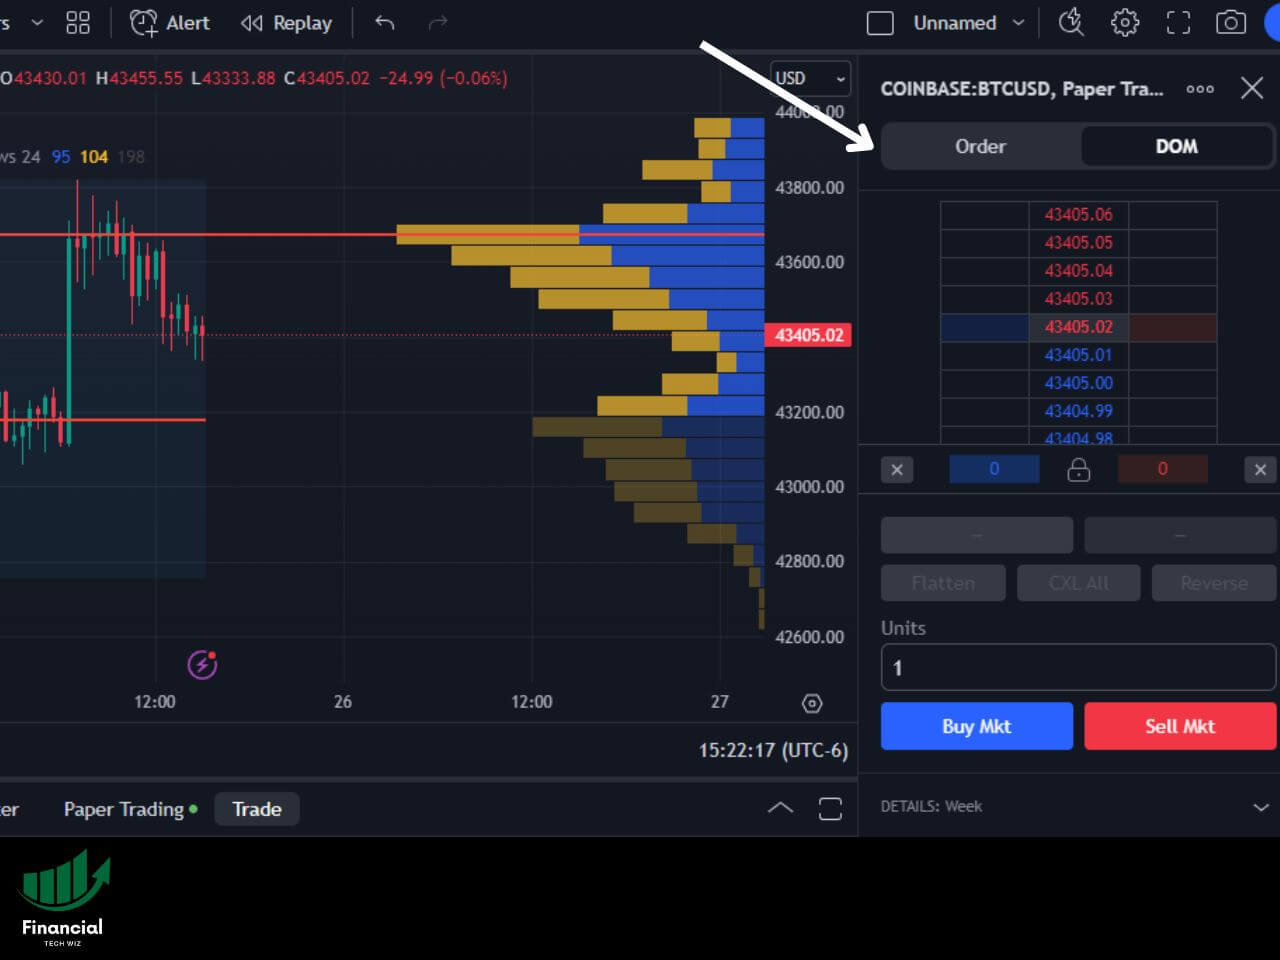
Backtesting on TradingView
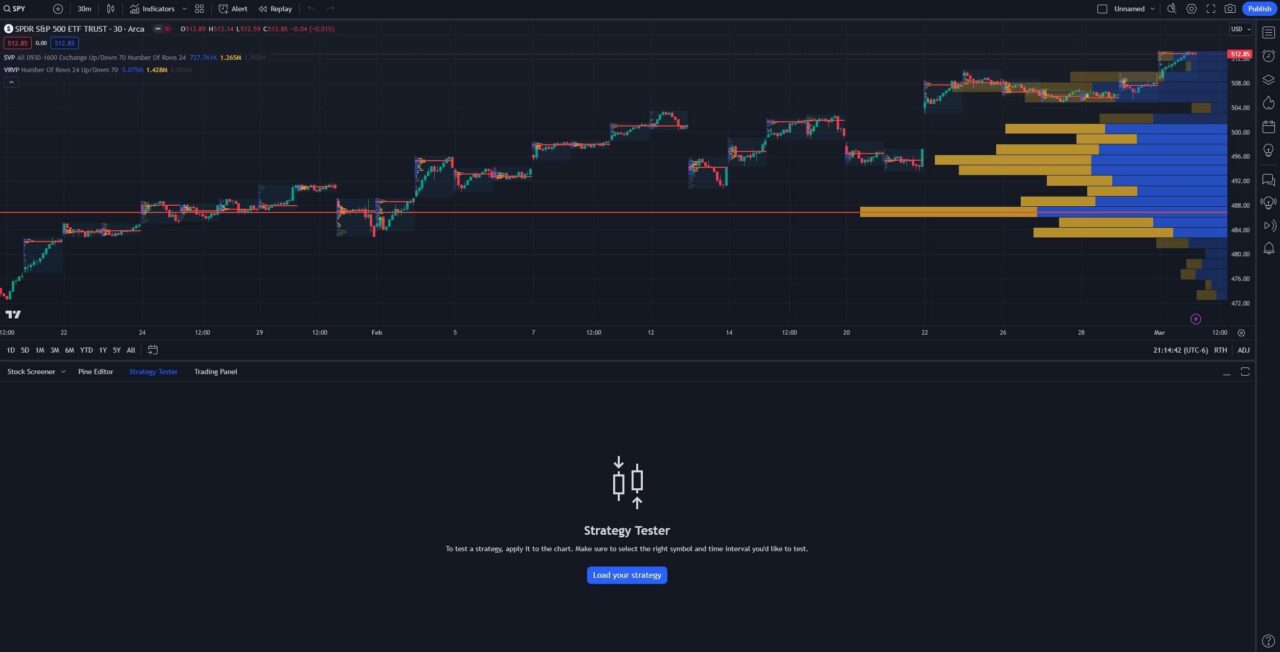
TradingView allows you to backtest strategies with the bar replay feature and the strategy tester. The bar replay feature is available to free users and allows you to backtest trades directly on a live chart.
The strategy tester is a way to backtest Pine Script coded strategies. There are some community-made strategies you can use, plus you can create your own. You can read our TradingView backtesting guide for more information.
Settings Alerts on TradingView
TradingView allows you to set alerts on both price and technical indicators. For example, you can set an alert if an asset moves above or below a specific price, allowing you to stay on top of your positions even when you aren’t actively watching the charts. You can also set alerts based on indicators, which is especially useful for indicators that provide buy and sell signals like moving average crossovers.
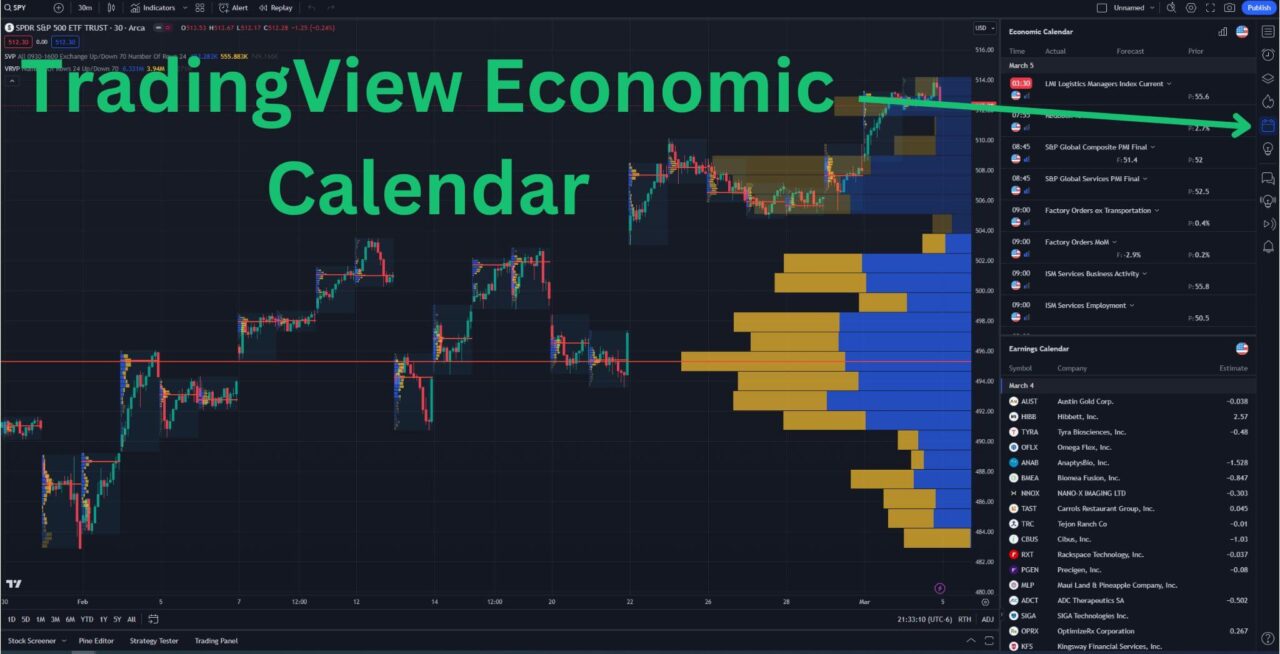
TradingView’s Economic Calendar
TradingView has an economic calendar you can view right next to your chart while you trade, which is great for staying on top of market-moving news like Fed announcements and economic data releases.
You can filter by country, allowing you to pick which news is most important to you. Another feature is you can select the high-importance filter, ensuring you only see significant news events on the calendar.
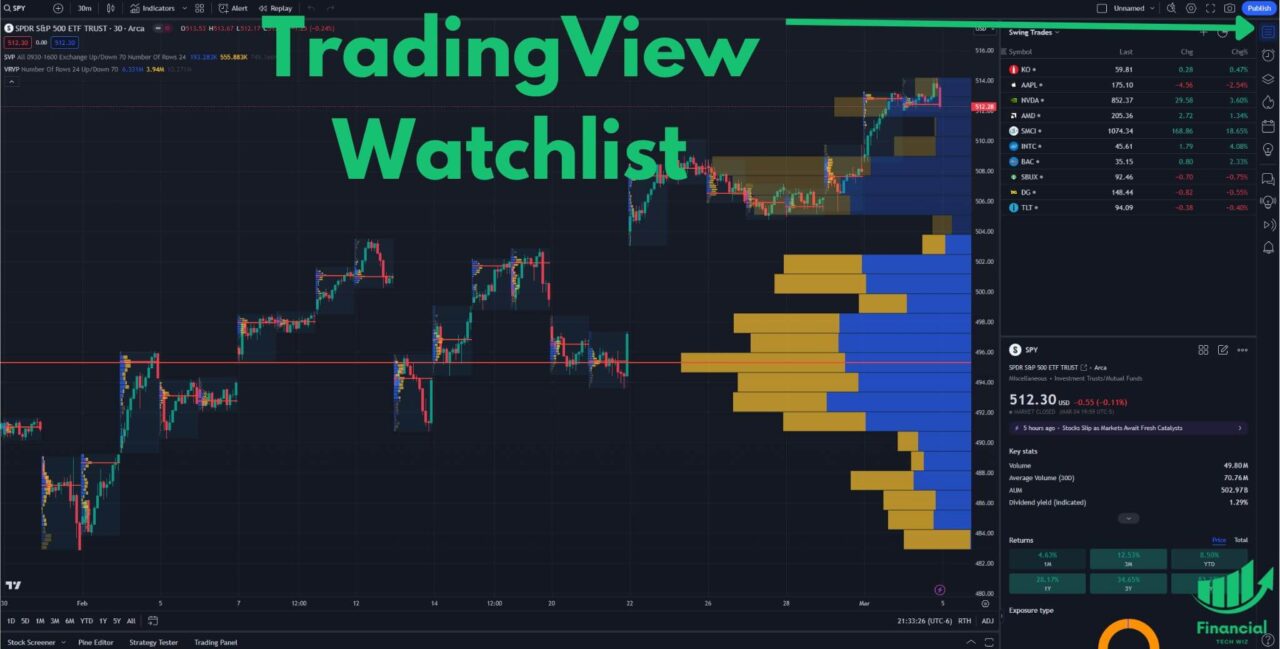
Creating Watchlists on TradingView
You can create and view your watchlists on TradingView by clicking the icon at the top right corner. Once you click the watchlist icon, you can create new watchlists by using the plus icon. You can change to your other watchlists by clicking on the name of the watchlist you are currently viewing to toggle between them.
Accessing Real-Time Data
When it comes to active trading, having access to real-time data is essential. For most instruments, you can buy real-time data from the exchanges directly through TradingView.
Note that a paid subscription does not include real-time data as it is a subscription cost ranging from $2-$10 per month. To learn more about real-time data on TradingView, check out our detailed article on the subject.
TradingView User Reviews
Overall, TradingView has many positive reviews but also some negative ones. It has an A+ BBB rating and tons of reviews on Trustpilot you can view. Here are some recent customer reviews from credible sources:
Positive Reviews
Positive TradingView reviews praise its intuitive layout, helpful customer support, and call it an essential one-stop shop for all trading information needs.
“Simply the best place to get all trading info you may ever need for any kind of trading, from the most conservative stocks to crypto. The ultimate one-stop solution for any tech analysis.” – Vlad on Trustpilot on 19 Dec 2023
“This is a fantastic platform in my opinion. I’ve been using it for a few years now (both the web version & app) and have had no issues. Everything is extremely well laid out and easy to access. What I find especially great about it, is that is has features I didn’t even know I wanted until I was in need of them. Customer service has always been on point in my experience too, I usually get a response within 24 hours. Great job TradingView … keep it up!” – Edward on Trustpilot on 17 July 2023
“Great software, great tools and community. But automatic payments were ON, after 2 years they billed me 190$. I opened a support ticket, and they refunded me within a few hours. Excellent support team and software!.” – Jochem on Trustpilot on 3 July 2023
Negative Reviews
Negative TradingView reviews complain about customer service being hard to reach. Many people have trouble finding how to contact support. According to Trustpilot, the support email for TradingView is: [email protected], and the phone number is: +1 833 247 1523.
“No phone number or email provided on website and no way to talk with anyone for billing issue. Sign up for free trial and keeps withdrawing money from our account without our authorization. Ask to open a ticket for support, however, you have to go through the list which does not have your problem at all and they design the way you never reach to the last step to open a ticket. If they don’t want to talk with the customer, why they have a business?” – JH on Trustpilot on 28 Nov 2023.
TradingView Review – My Final Take
TradingView offers a wide range of tools and charts, an active community of traders, and flexible pricing options. It is definitely worth considering if you’re looking for a trading analysis platform.
The free version of the platform is great for casual investors and allows you to view most assets with nearly real-time data for free.
If you are actively trading and require advanced indicators, more charts per layout, and real-time data, you should consider upgrading to a paid plan.
When you sign up for TradingView using my link, new users can usually get a free trial and a discount on a premium subscription!